The S&P 500 surged over the last four days and new highs in the S&P 500 expanded to their highest level since March 2015. The chart below shows $SPX surging around 5% in four days and new highs exceeding 80 the last two days. Even though the index did not exceed its May or November highs, new highs expanded significantly and this shows broad strength in the S&P 500. This means 16.4% of stocks in the S&P 500 hit new highs on Friday. Not bad at all. I will show how to create this chart after the jump.
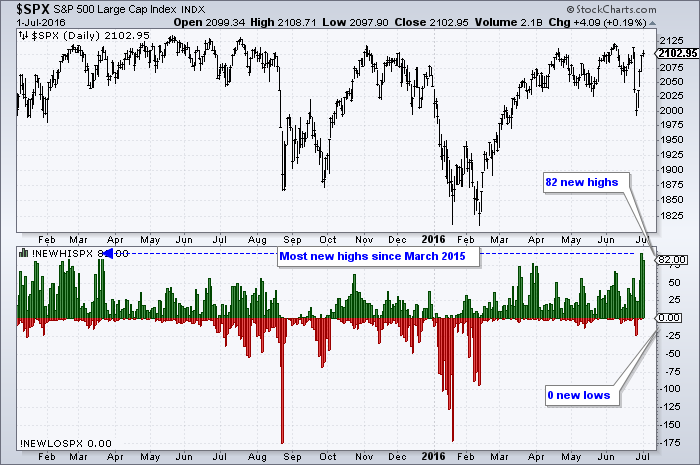
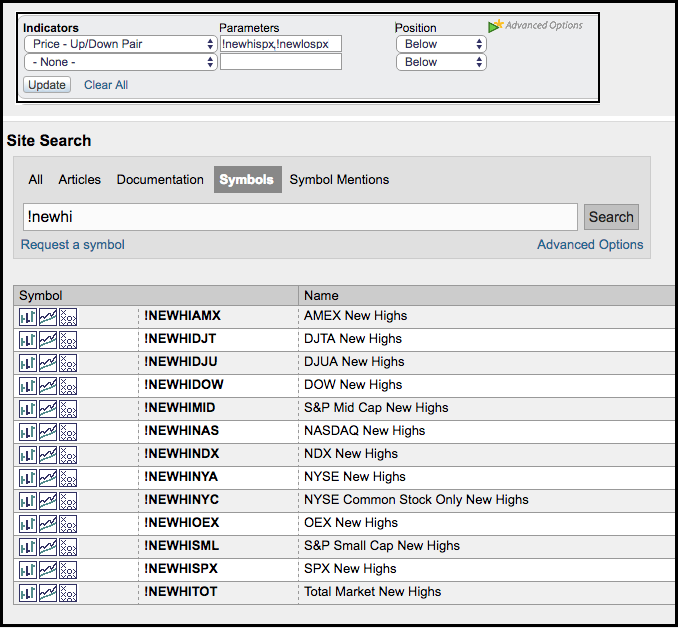
This chart was created by selecting "Price Up/Down Pair" as an indicator and then entering the two symbols in the parameters box (separated by a colon - !NEWHISPX:!NEWLOSPX). You can change the index symbol to see new highs and lows for other indexes as well ($SML, $MID, $NDX).
 ****************************************
Thanks for tuning in and have a great day!
--Arthur Hill CMT
Plan your Trade and Trade your Plan
*****************************************


