Crude oil prices ($WTIC) have been hovering between $40-$52 per barrel for the past six months, but the bottoming reverse head & shoulders pattern is telling us to watch closely to see if we can get a confirming breakout on this pattern above neckline resistance at $52. In the meantime, the energy sector ETF (XLE) remains in a very bullish pattern with rising 20 week EMA support holding on every pullback since breaking above this key moving average in late February. Check it out:
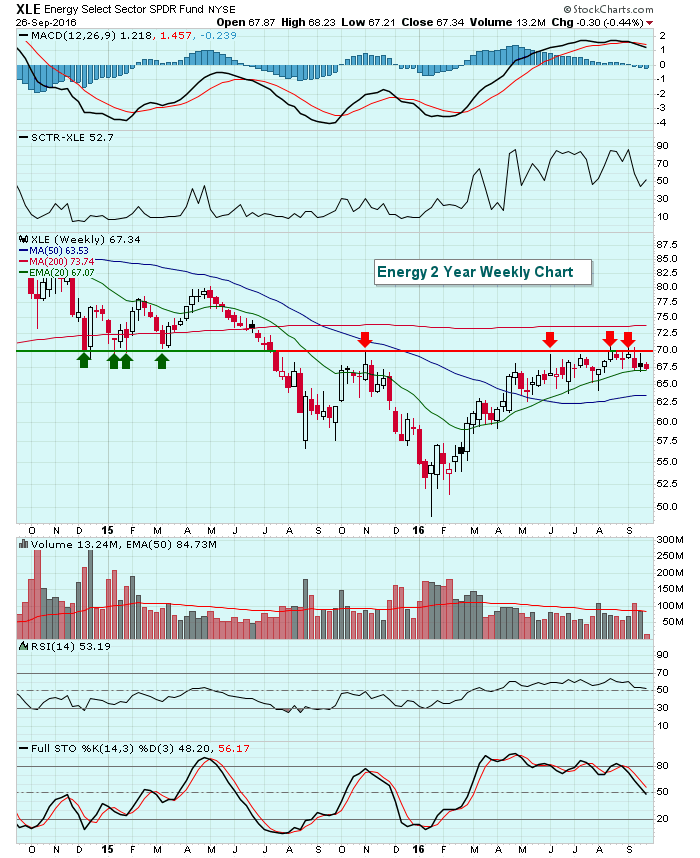 The energy SCTR has fallen back to the 50 level, but still remains elevated from where it was earlier in the year. At this point, you should keep an eye on support close to 65 while price resistance clearly is marked at 70.
Happy trading!
Tom

About the author:
Tom Bowley is the Chief Market Strategist of EarningsBeats.com, a company providing a research and educational platform for both investment professionals and individual investors. Tom writes a comprehensive Daily Market Report (DMR), providing guidance to EB.com members every day that the stock market is open. Tom has contributed technical expertise here at StockCharts.com since 2006 and has a fundamental background in public accounting as well, blending a unique skill set to approach the U.S. stock market.
Learn More