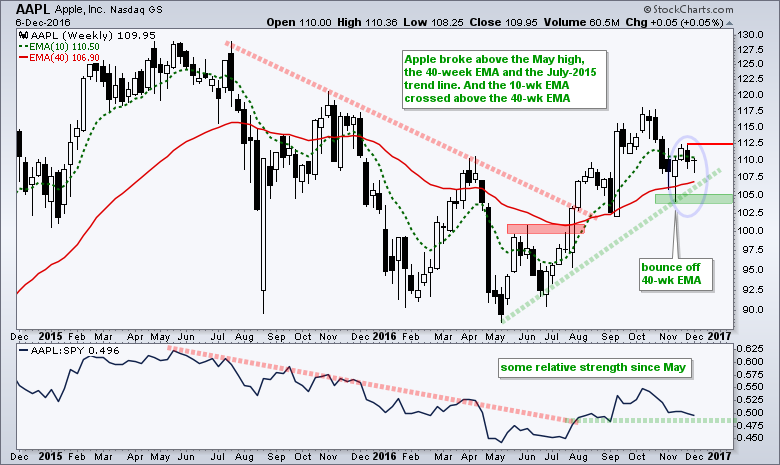
Apple (AAPL) reversed its long-term downtrend with a series of breakouts this summer and the stock is currently trading over 20% above its May low. Notice how the stock broke the early June high, the red trend line and the 40-week EMA with a surge in July-August. The 10-week EMA also crossed above the 40-week EMA in August. Even though the stock underperformed in October-November, Apple found support near the rising 40-week EMA and could be poised to continue higher.

Notice how the stock formed a hammer-like candlestick four weeks ago and then stalled around 110 (blue oval). I am calling this hammer-like because the lower shadow is a bit short for a hammer. Normally, the lower shadow should be twice as long as the body of the hammer. Steve Nison, author of Japanese Candlestick Charting Techniques, notes that chartists should allow some flexibility when interpreting candlestick patterns. I ask myself whether or not the candlestick captures the spirit of the pattern. I think the candlestick four weeks ago captures the spirit of a hammer because the stock dipped below 105 during the week and then recovered to close the week near 110, which was also near the high of the week. This was clearly a reversal week and I am now watching for a little follow through. Chartists interested in Candlestick can also read this thorough introduction in the ChartSchool.
A break above last week's high (112.5) would show follow through and suggest that the overall uptrend is continuing. I will be watching the candlestick low (104) as support. A close below this low would signal a failed reversal attempt and break the 40-week EMA.
****************************************
Thanks for tuning in and have a great day!
--Arthur Hill CMT
Plan your Trade and Trade your Plan
*****************************************


