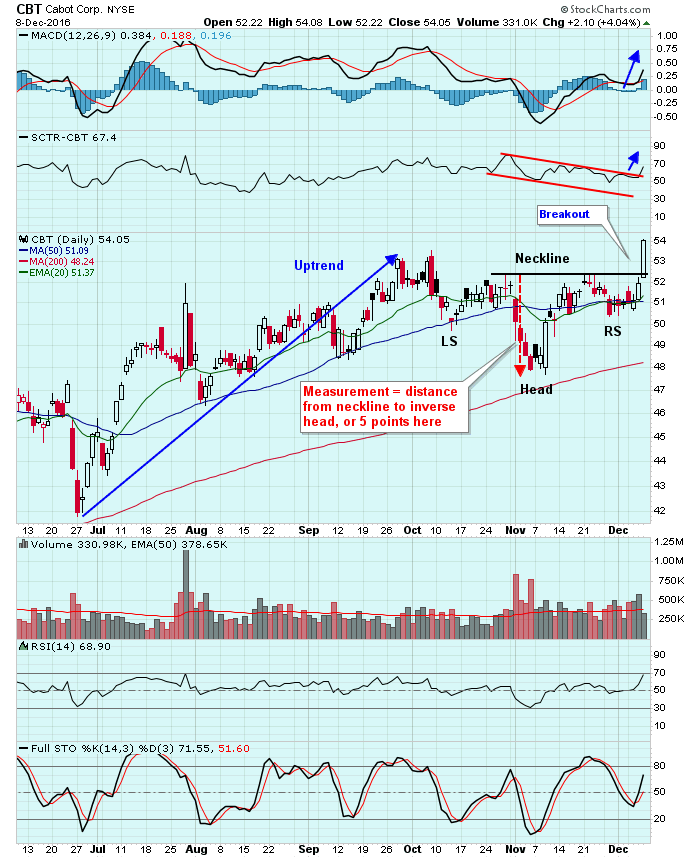
It took two months of consolidation, but Cabot Corp (CBT) finally pulled it off. It cleared neckline resistance in its inverse head & shoulders pattern at the 52.50 level. One of the keys of any continuation pattern is that it requires a prior trend in place to continue. CBT trended higher throughout July, August and September and then its SCTR ranking channeled lower as it consolidated in its recent inverse head & shoulders pattern. The breakout occurred today on nice volume and here's how it looks visually:
 Now as it's broken out above price resistance, you can see that its MACD is now surging and its SCTR rank has broken its recent down channel. All of this sets up for higher prices, but how much higher? Well, the beauty of patterns is that they provide measurements and targets upon breakout. In this instance, the inverse head & shoulders measurement is based on the distance between the neckline and the bottom of the inverse head, which is 5 points. Tack that on to the breakout of 52.50 and you get a potential measurement to a 57.50 target. While not shown above, there's long-term price resistance at 57.50 from the 2014 price high on CBT. That would corroborate the likelihood of an advance to that price level. In the meantime, best entries into CBT would now be neckline support at 52.50 and the rising 20 day EMA, currently at 51.37.
Happy trading!
Tom


