Xilinx (XLNX) is a $13.5 billion semiconductor company and it nearly broke out of a very bullish inverse head & shoulders pattern on heavy volume today. But it didn't. Instead, it reversed lower along with most semiconductor stocks and tested its rising 20 day EMA. The technical picture here still remains quite bullish as you can see from the chart below:
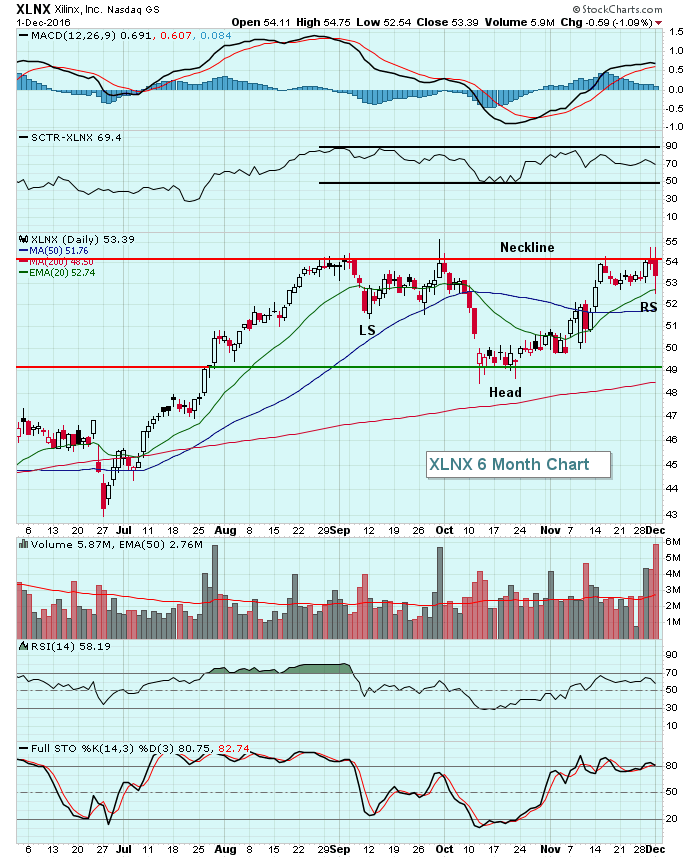 The biggest problem for XLNX right now isn't XLNX. It's the weak relative performance of all technology stocks. The Dow Jones U.S. Semiconductor Index ($DJUSSC) fell 4.5% on today's session. Obviously, if its peer group continues to struggle, XLNX will have a much lesser opportunity to break out of this bullish pattern. The 20 day EMA and 50 day SMA are two key moving averages that could mark a potential inverse right shoulder so look for reversing candles there. Continuing high volume and a close beneath the 50 day SMA would likely lead to further selling and a possible rectangular consolidation. That development could lead to a drop in XLNX down to the 49 level to test its October low.
Happy trading!
Tom


