Alibaba (BABA) has been building a consolidation pattern recently. After pulling back for four months, BABA started to turned higher. In the zoom box you can see the gap up on earnings. Now the stock is trying to break through the top of the cup and handle setup at $104.57.
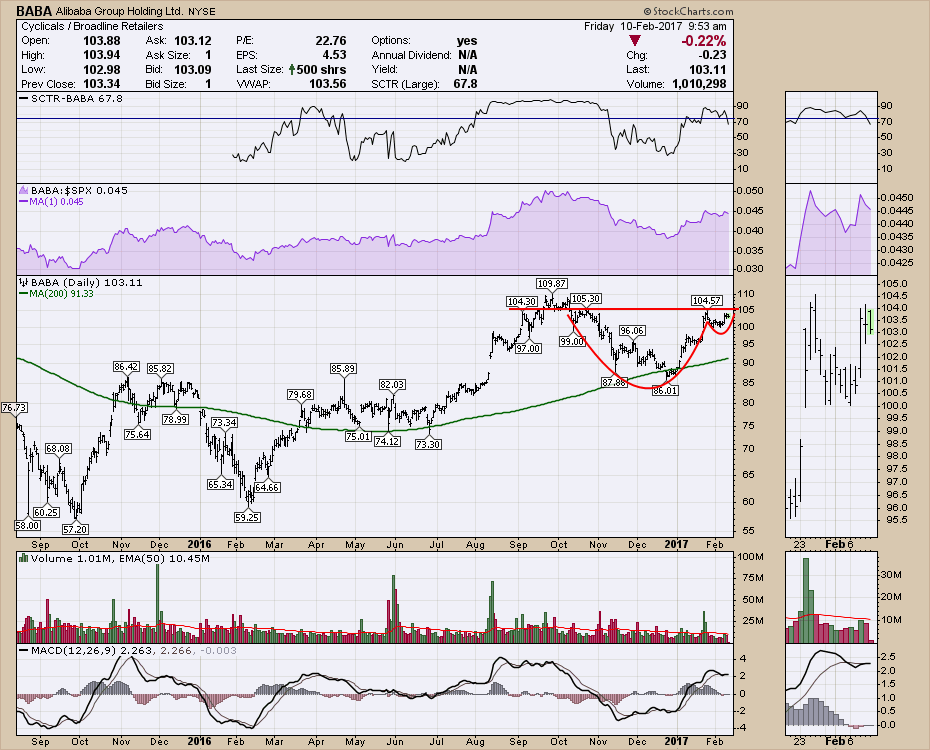
BABA trades big volume with the average over 10 Million a day. The MACD is up in positive territory and the typical cup and handle pattern is setting up for a strong move to the upside with the handle structure a small percentage of the overall cup size.
If you would like to become a StockCharts member, we have a couple of things going on this week that make this an important time to subscribe.
Setting up the 'custom' CandleGlance tool was described in the Tuesday webinar. This makes it very easy to visually view stock patterns that you like to trade with your own settings from a chartlist. On the webinar from Thursday, I showed how to analyze a chartlist for stocks turning up in a sector that has been sold off by using a very simple scan that members can use. On Saturday, I will make sure that members know how to set up their own chartlists. I have over 200 chartlists and find them very valuable.
On Saturday, Tom Bowley and I will be doing a special event for a market outlook and we plan on focusing on two different areas of the market that we think holds promise in the near future. This is a members only webinar. One of the purposes of the webinars are to help existing subscribers streamline their workflow to make more profit by being well setup with chartlists and custom settings. We hope to make those nuggets of information available on the webinar. If you would like to become a member to utilize these tools, you can click this link to get access to the webinar on Saturday. Use the code BESTCHARTS to get a 10 day free trial.
Good trading,
Greg Schnell, CMT, MFTA.


