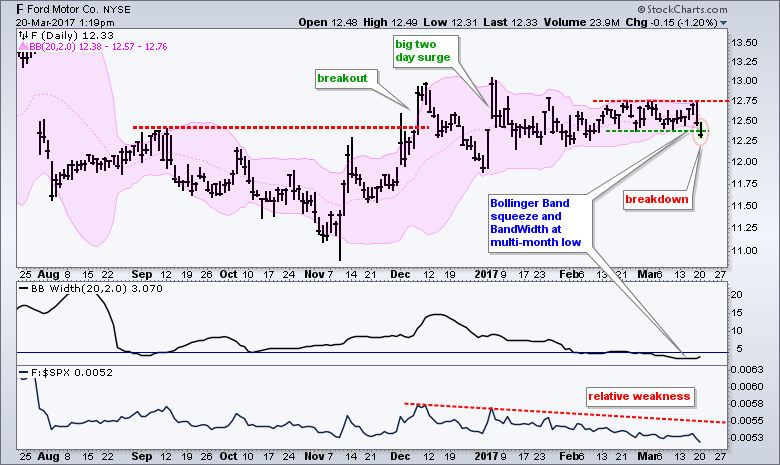
Ford (F) looked as if it was simply consolidating after a sharp surge and breakout, but this consolidation strung out and the stock broke to the downside on Monday. The chart shows Ford breaking above the September high with a surge in November-December. The stock fell back after this breakout and again surged with a big two-day advance. It looked like Ford was poised for further gains in early January, but the stock fell right back and then embarked on a long consolidation.
The pink area shows the Bollinger Bands contracting as the consolidation extended and the indicator window shows the BandWidth indicator dipping to its lowest level in months. This means volatility contracted and we should expect a volatility expansion. A break above the upper band and range resistance would have been bullish, but this did not happen. Instead, the stock broke the lower band and short-term support.
In addition to this bearish development, the lower indicator window shows the price relative (F:$SPX ratio) moving to multi-month low. Ford has been lagging the S&P 500 since mid December and this adds weight to the support break. The tea leaves point to lower prices and it would take a break above 12.75 to suggest otherwise. âÂÂ
****************************************
Thanks for tuning in and have a great day!
--Arthur Hill CMT
Plan your Trade and Trade your Plan
*****************************************

