I know it was Fed day Wednesday, and Quadruple Witching Options Expiration Day today. I know it's St. Patrick's Day and they'll be partying around the world with green beers and Shamrocks. So in the world of StockCharts, we need to get on the St. Paddy's day bandwagon as the EEM chart is sending a green message today too. Look at the green volume candles for EEM on Wednesday and Thursday. This volume is soaring with 250 million shares trading in a two day period! The really interesting part is that the same sort of volume hit the ETF on the Trump Jump back in November, but those days were selling days. The ETF has rallied ever since.
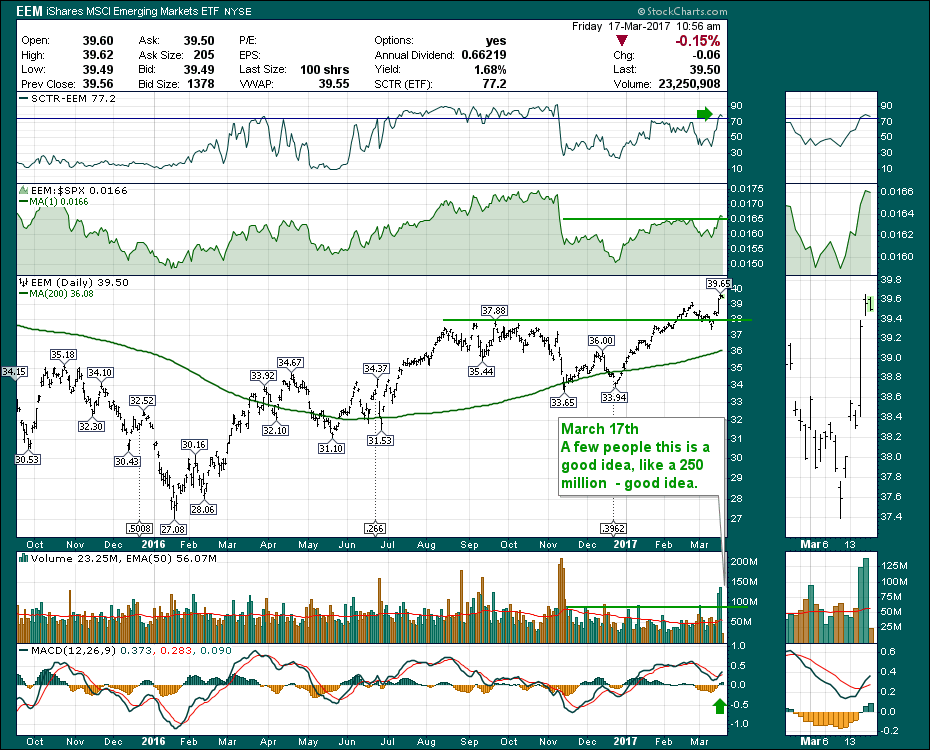
The chart looks like it wants to go higher here. Emerging Markets are well correlated to Commodities but recently Commodities have underperformed. They do have periods where they do not track. Perhaps this is a signal to watch Commodities for a big upside reversal.
For the educational segment of the blog, I want to help everyone change the default chart color that they see when they first become a member of StockCharts. I want to thank everyone for subscribing to StockCharts.com and our goal here is to make you as familiar as possible with all the little customization tools.
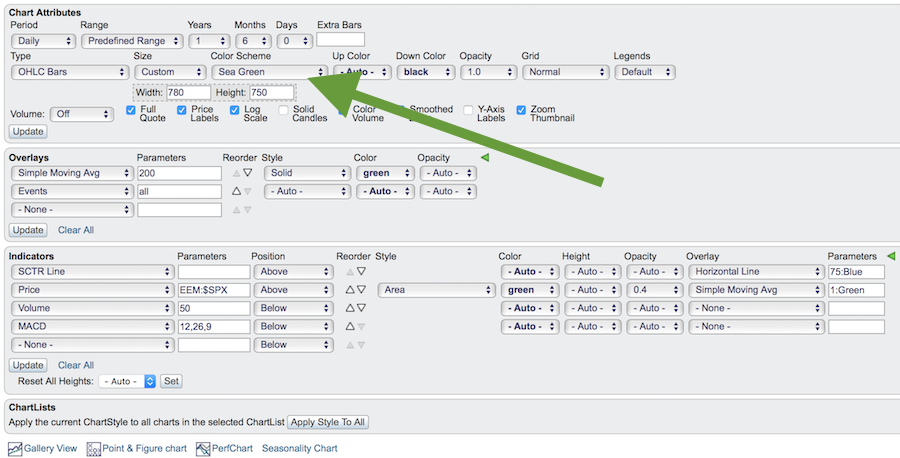
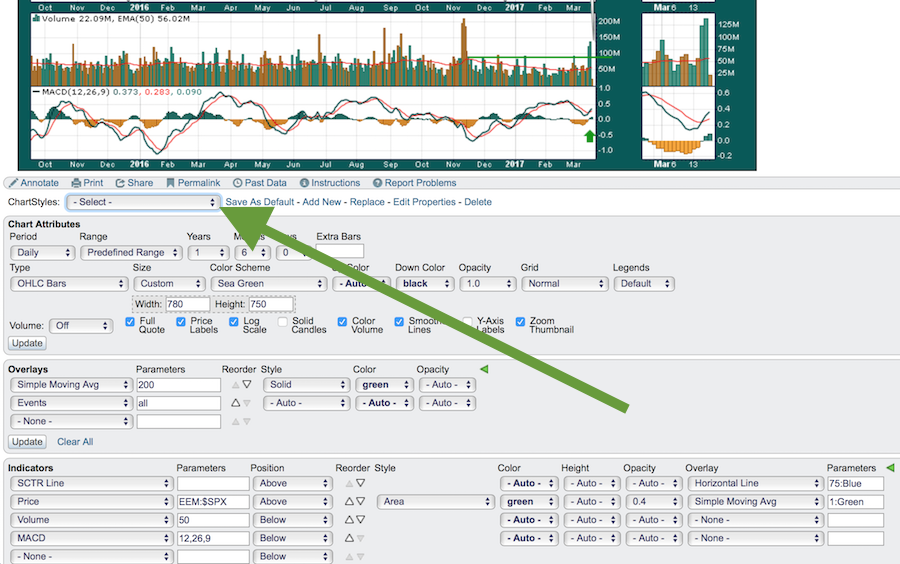
In the Chart Attributes area below the SharpChart, you can select a predefined chart color scheme from the dropdown list. However, if you have a particular chart style you like, you can save it as your default or you can set up multiple chartstyles and quickly flip between them.
First of all, it's real easy to get a different look. Working in the top area of Chart Attributes, the color Scheme I used for the EEM chart was Sea Green.
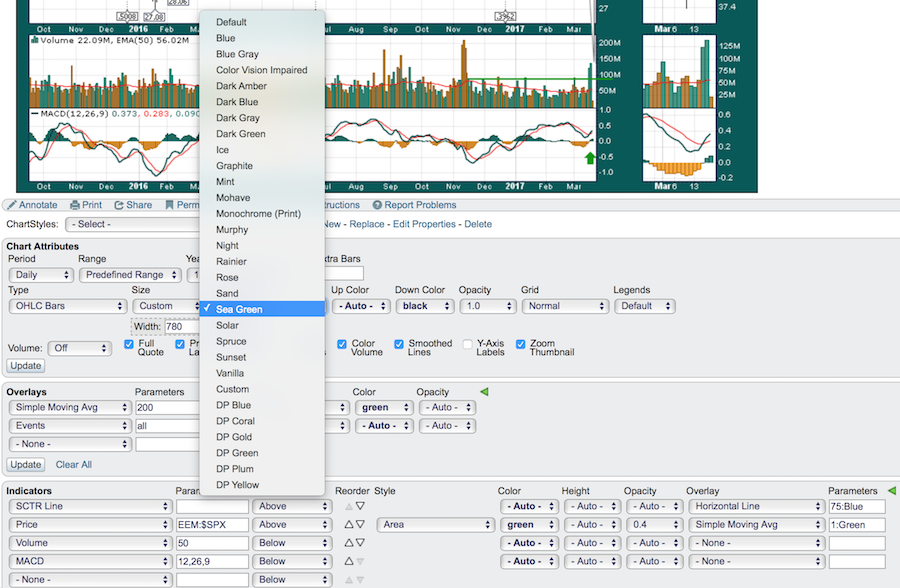
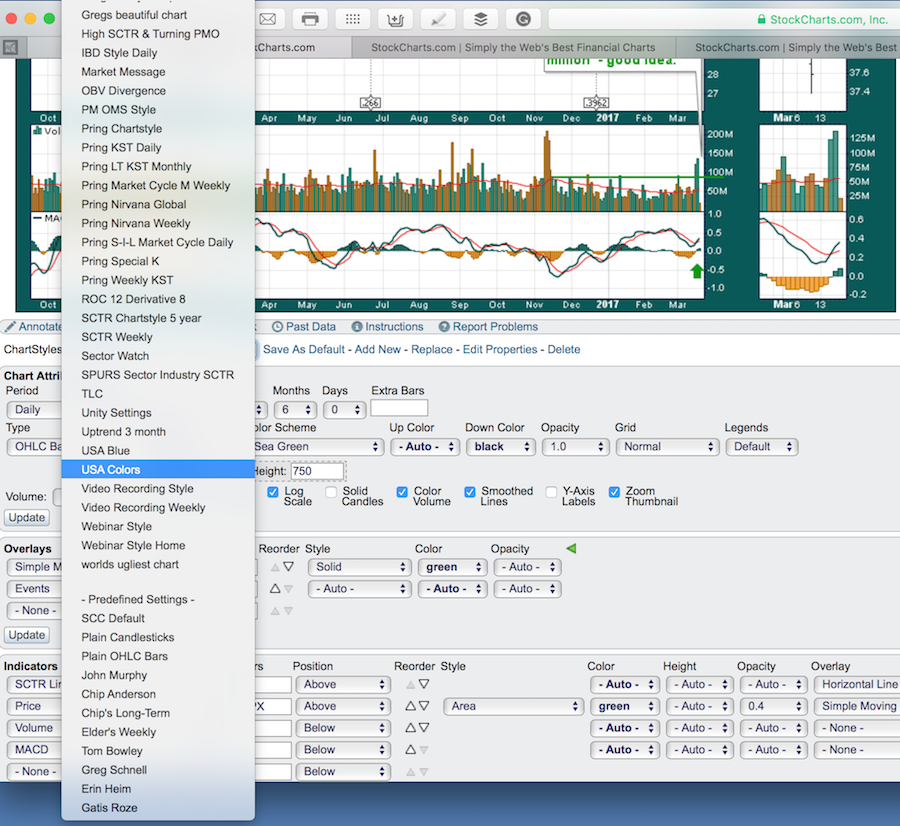
 Click on the dropdown to reveal many choices. Try them out, there are lots of predefined choices.
 To save the Sea Green background and all the indicators as a default ChartStyle,(we call this a ChartStyle when you save the color scheme and the indicators to make a preset group of things all appear with one click) click the 'save as default' button. If you would like to save it as a ChartStyle but not your default chart style, click 'add new' instead and give it a name.
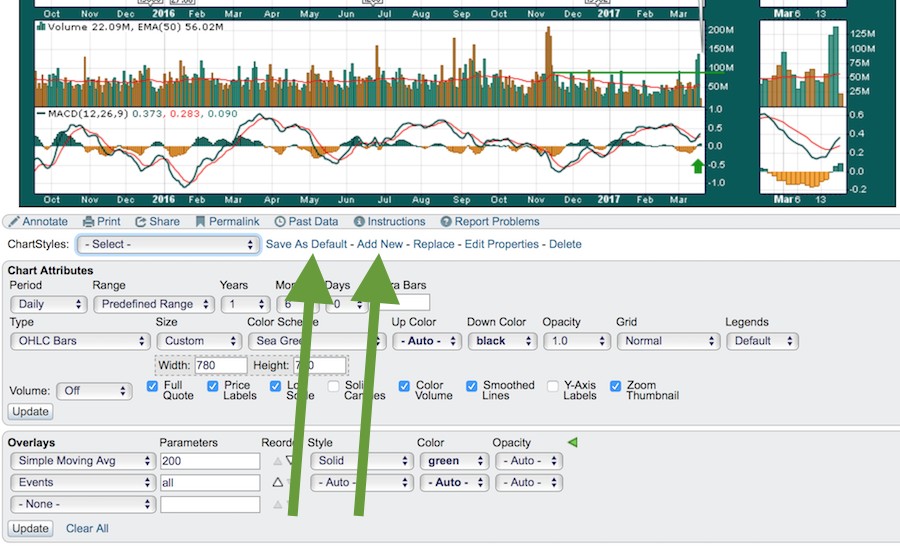 There are a bunch of default ChartStyles or you can see one in a blog that you like, click on it, and then save it to your SharpCharts Workbench by clicking Add New and give it a name. Simply click on the ChartStyles dropdown list to use that ChartStyle anytime.
 There are presets from most of the authors at StockCharts and in my list I have saved a bunch of the Pring Chart settings and called them some Pring style name like Pring S-I-L for Short, Intermediate, Long as an example. I have highlighted a chartstyle I made for July 4th using Red, White, and Blue.. Notice at the bottom are the author preset styles.
 I never want to see another default chart again! Color it up, have some fun and today, try to get some green on your charts and your trading accounts!
Links for Arthur's videos and my videos are no longer found on the Home Page. They are only found on the blog scroll for each blog. So my Commodities Countdown Video link will be on the Commodities Countdown blog page. The same for the Canadian Technician Videos and Art's Charts Videos.
For my 30 chart quick view, click here.
Good trading,
Greg Schnell, CMT, MFTA.


