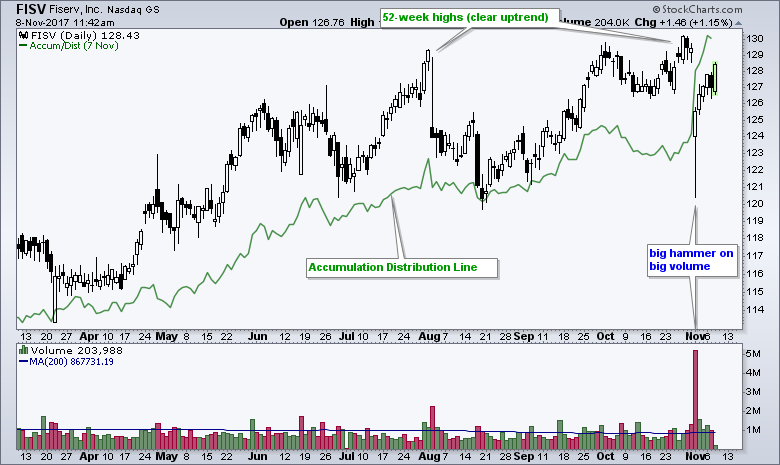
Fiserv gapped down and fell on big volume last week, but the candlestick points to an accumulation day and the Accumulation Distribution Line hit a new high. First and foremost, the big trend is up because Fiserve hit a 52-week high with a move above 130 in late October. FISV then gapped down with an open around 124 and closed lower on the highest volume of the year. Despite the lower close, I think this was an accumulation day because the stock dipped below 121 during the day and closed near the high of the day. This candlestick looks like a massive hammer and the ability to close near the high of the day shows accumulation. This is reflected in the Accumulation Distribution Line (ACDL), which surged to a new high on this reversal day. Check out the ChartSchool article to learn why? I will give you a hint. This indicator measures the close relative to the high-low range to measure accumulation and distribution. Given the bigger uptrend, the hammer and follow through over the last few days, I would expect Fiserve to continue its uptrend and record a new high in the coming weeks.

Follow me on Twitter @arthurhill - Keep up with my 140 character commentaries.
****************************************
Thanks for tuning in and have a good day!
--Arthur Hill CMT
Plan your Trade and Trade your Plan
*****************************************


