 The chart for CBS Corp (CBS) is already bad news and the news could get even worse.
First and foremost, the long-term trend is clearly down as the stock hit a 52-week low in early November and remains below the falling 200-day SMA. The stock also broke below the May-June lows during the move to new lows.
The shaded area around 60 marks a resistance zone that could give way to a reversal. First, the broken support zone turns into a resistance zone. Second, notice that the November-January rebound retraced 50-61.8% of the prior decline. Third, the falling 200-day SMA is in the 60.5 area.
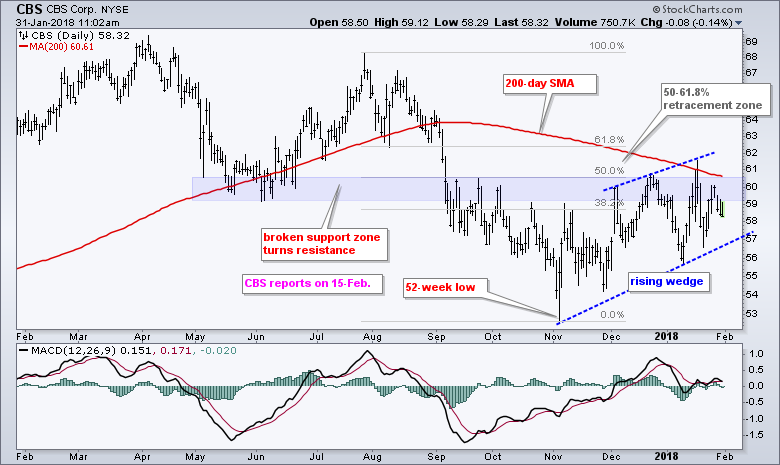
There are two things to watch for a reversal. First, a MACD move below zero would signal that the 12-day EMA moved below the 26-day EMA. Second, a move below the wedge line at 56.5-57 would start a pattern break. Such moves could signal the end to this corrective bounce and the resumption of the bigger downtrend. Note that CBS reports earnings on February 15th.
Plan Your Trade and Trade Your Plan.
- Arthur Hill, CMT
Senior Technical Analyst, StockCharts.com
Book: Define the Trend and Trade the Trend
Twitter: Follow @ArthurHill


