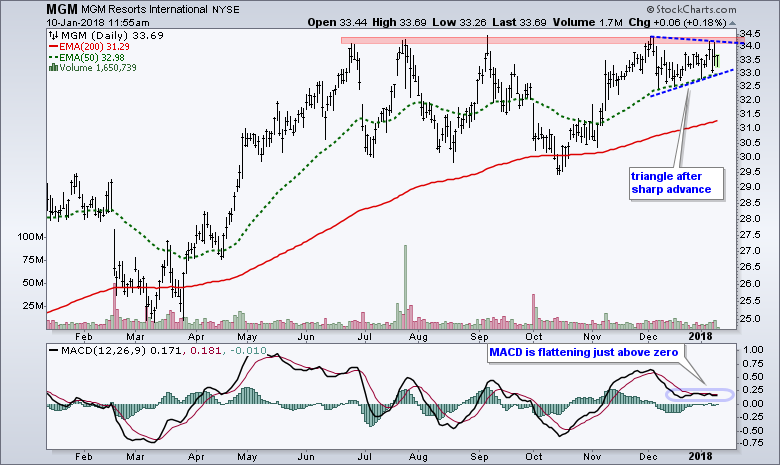
MGM Resorts (MGM) is gearing up for a resistance challenge and the speculator in me expects a breakout. First and foremost, MGM is in a long-term uptrend with the September 7th spike marking a 52-week high. The 50-day EMA is also above the 200-day EMA and price is well above the rising 200-day EMA.
The stock surged some 15% from mid October to late November with a move to the resistance zone. A triangle consolidation then unfolded and a consolidation after an advance is typically a bullish continuation pattern. A break above the early January highs would be bullish and signal a continuation higher.
The indicator window shows MACD flattening out just above the zero line. This means the 12-day EMA is hovering above the 26-day EMA. Look for a move above .25 to signal an upturn in MACD and further the separation between the EMAs (12-EMA getting further above 26-day EMA).
Bottom Line: The odds favor a breakout on the price chart because the long-term trend is up and a bullish continuation pattern is forming. A close below 32.5 would negate this thesis.
Thanks for tuning in and have a great day!
--Arthur Hill CMT
Plan your Trade and Trade your Plan


