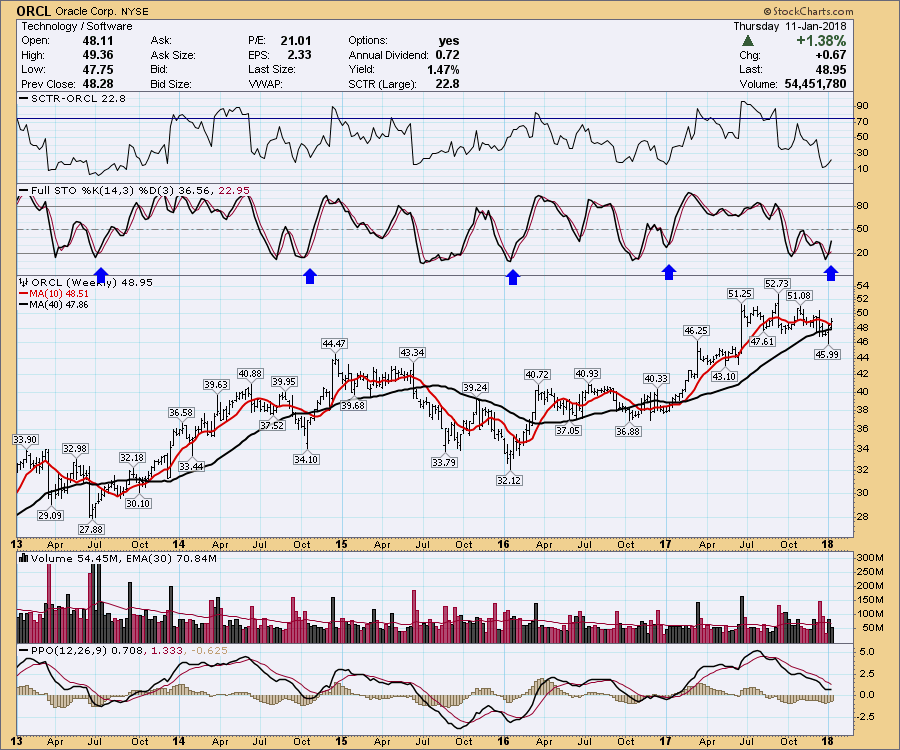
Oracle stock (ORCL) has been languishing lately, but the stock showed up this week on one of my weekly scans. When I started to look more deeply, I noticed that signals on the Full Stochastics panel usually need to double bounce or double dribble. It starts to bounce up then rolls over and takes roughly three months to make the second tradable low. The crossing of the 20 line to the upside is something I like to scan for. Notice every year the best low was about three months after the first signal.
The PPO looks like it is resetting as well. The histogram is starting to improve but still has work to do. The solid bounce in the price last week, pushing higher this week looks great. Just when the 10 week MA is about to cross down below the 40 week MA, the stock is starting to rally. My stop would go just below this weeks low at $47.65.
Currencies are really important this week!
I recorded a video pointing to some important charts in the currency sphere this week. I have included a link below, if you are interested.
Commodities Countdown With Greg Schnell 2018-01-11 from StockCharts.com on Vimeo.
Also I am doing the Market Outlook this week with Don Vialoux. He is a senior statesman on Seasonality! You can catch us live at this link on Saturday at 11 AM ET.
If you missed my article on Marijuana stocks that are up 100% within the last three months, you can find that article here. Medical Marijuana Stocks.
Good trading,
Greg Schnell, CMT, MFTA


