Symantec (SYMC) spent 18 months rising off the lows of 2016. But since February of 2017, it has continually tested, found support at and held $28.00. This week the stock pushed off that level one more time. There are good reasons to look at a trade here.
The relative strength of SYMC has been beaten down as shown by the SCTR ranking. However, this week it closed at 2 month highs with the SCTR moving out of the bottom quadrant and now sits at 25.8. While that's promising, it still points to a pretty weak stock. I find two particularly interesting places on the SCTR rankings. One is stocks accelerating into the top quadrant or the top 25% (An SCTR ranking above 75). The other group I like is when a stock accelerates from being unloved and moves out of the bottom 25%. Symantec is particularly interesting this week as it meets that second condition.
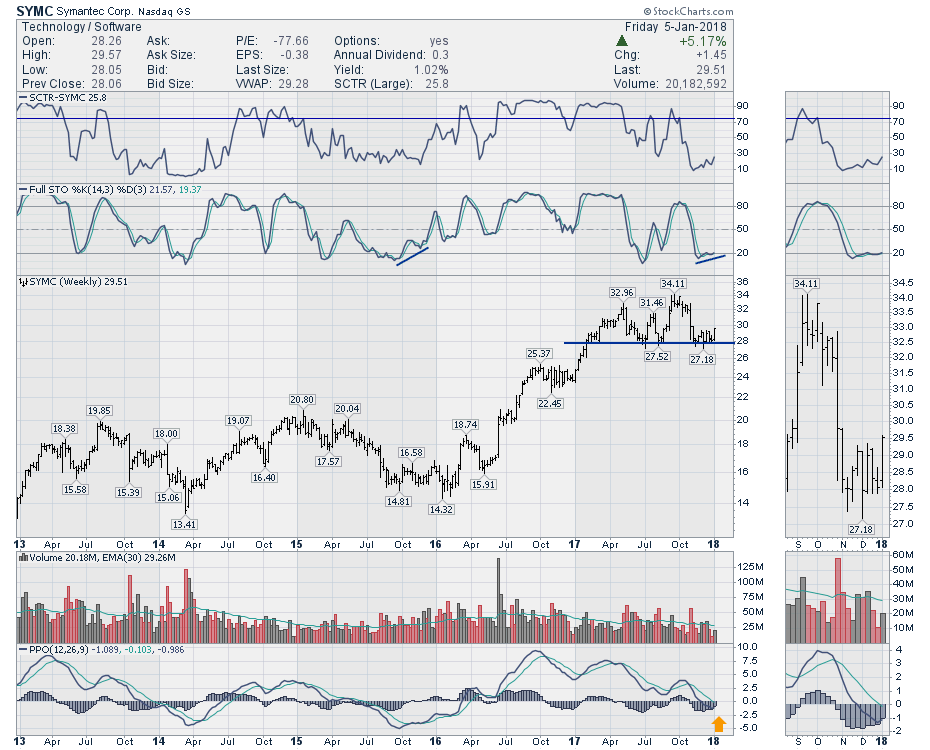
However, the way I found this stock was my weekly Full Stochastic scan. It uses the indicator in the second panel and looks for a signal of the Full Stochastic line crossing above the 20% level. This weeks list had 30 stocks on it. You can read the nicely detailed ChartSchool article, written by Arthur Hill, here.
In the zoom panel on the right, we can see the stock moved to new 6-week highs and moved up 5% after continually finding support at $28. The MACD has reset near zero and the histogram has improved for 4 weeks. A look back in 2016 when the broader markets were pressing lower, Symantec showed a nice base being built for almost 6 months before the stock launched an uptrend. With the current base at 11 months, and support close by, this looks like a nice entry location with a stop just below support. Perhaps the next run will generate 100% gains like the last one.
Good trading,
Greg Schnell, CMT, MFTA.
