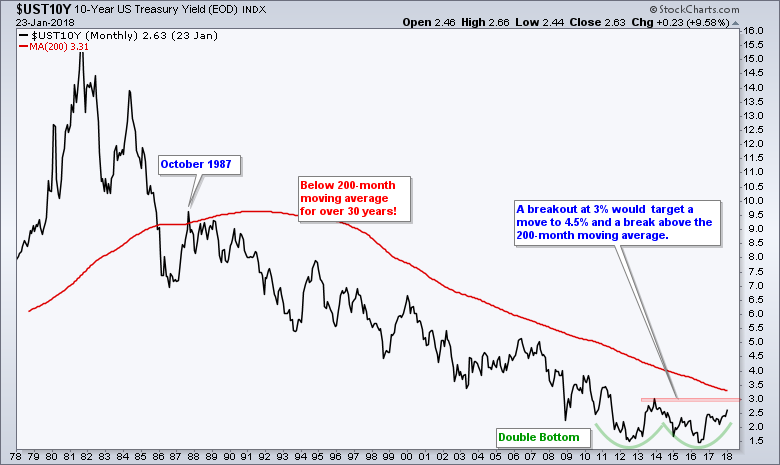
The 10-year Treasury Yield peaked near 16% in 1982 and fell as a secular bear market took hold for over 30 years. After stabilizing the last few years, the 10-year Yield traced out a large bullish reversal pattern and confirmation would end the secular bear market.
Note that the 10-yr T-Yield ($UST10Y) is a mirror image of the spot price for the 10-year Treasury Note. Thus, a bullish reversal pattern in the 10-year Yield translates into a bearish reversal pattern for the 10-year Treasury Note (i.e. Treasury Bonds).
The chart shows a massive Double Bottom taking shape as the 10-year Yield successfully tested the 1.5% area twice in the last five years. These two lows established the Double Bottom and the intermittent high holds the key to this massive bullish reversal pattern.
A move above 3% would break the intermittent high and confirm the Double Bottom reversal. Applying some classical technical analysis techniques, we can add the height of the double bottom to the breakout level for an upside target (3 - 1.5 = 1.5). This targets a move to around 4.5% (3 + 1.5 = 4.5).
A move to 4.5% would also trigger a break above the 200-month moving average. Notice that the 10-year yield has been below this moving average for over 30 years. Thus, a Double Bottom breakout and moving average break would be truly momentus for the bond market.
A bullish pattern in the 10-year Yield implies a bearish pattern in the 10-year Note. Thus, the long-range forecast is bearish for the 10-year Treasury Note, and Treasury Bonds by extension. Macro players should also take note and prepare for a rising rate environment.
Plan Your Trade and Trade Your Plan.
- Arthur Hill, CMT
Senior Technical Analyst, StockCharts.com
Book: Define the Trend and Trade the Trend
Twitter: Follow @ArthurHill


