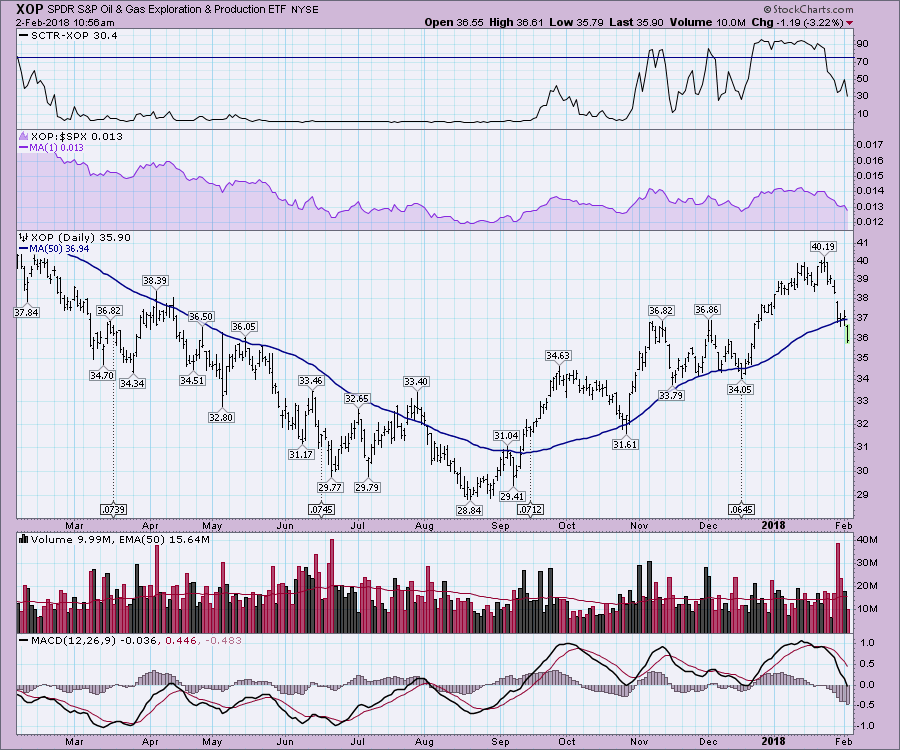
The Exploration and Production ETF (XOP) has shown a level of respect for the 50 day moving average (DMA) over the last year. From February 2017 to August 2017 it stayed below the 50 DMA. From September 2017 to January 2017 it stayed above the 50 DMA. Today it moved below the moving average into a new zone.
While it seems early in the fact that the $SPX is just a few percent off the highs, trade each sector or stock individually and take cues from the industry group.
This one is giving you a 'protect your portfolio' signal for Oil and Gas.
The Commodities Countdown article gives some additional charts outside of what was covered on the video this week. The Commodities Countdown video 2018-02-01 covers moves in the US and world markets at the beginning and commodities in the second half.
Commodity Markets Mixed In January 2018-02-01 from StockCharts.com on Vimeo.
As well Chartcon 2018 opened for registration ! Chartcon 2018

For Canadian investors I also recorded a Canadian technician video this week. You can find it inside this article. The Canadian Stock Market Goes Negative For The Year.
Good trading,
Greg Schnell, CMT, MFTA.


