JB Hunt is one of America's largest fleets. Amassing a fleet of over 12,000 trucks and 100,000 trailers, it's clear that JBHT has a pulse across North America's industries. With 124,000 employees, this industry is people intensive and flourishes when the economy is accelerating.
I am writing this article while heading north to the Montney oilfield in Northwest Alberta. I'm feeling the highway vibe their operators enjoy as the sky constantly changes while checking out the August 2, 2018 sunset.

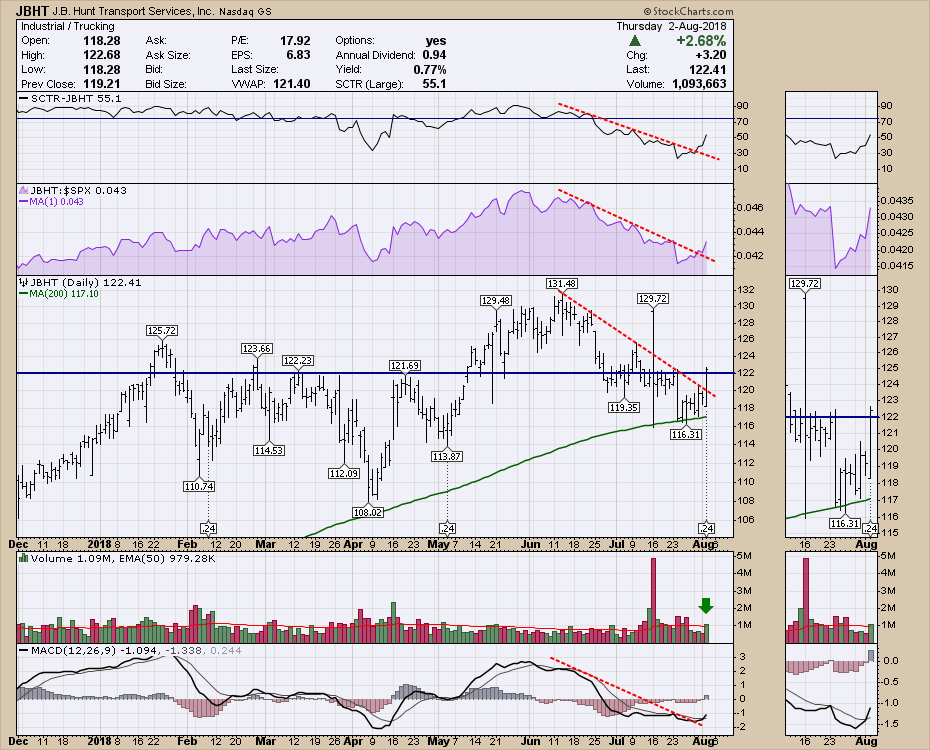
Thursday saw the chart of JB Hunt jump as buyers loaded up their shares. The chart tells a great story at this price point. The $122 level was big resistance in February, March and April. After a surge to new highs in June, buyers let the chart pull back to test the support around the 200 DMA. This morning, the chart gapped moderately lower as the US Indexes opened in the red. After that, buyers bid the stock up $4 throughout the days trading. The most visible trend on the chart was the break in the six week pullback. The SCTR surged back above 50. The relative strength downtrend broke. The price action broke the downtrend and pushed the price back up to the $122 level. The volume was a full 30% higher than all of the previous days this week and the MACD swung to a buy signal. Pretty compelling.
 With the US economy rolling pretty well, JB Hunt is well positioned to make some moves. The stock appears to be positioning for it. I would use a stop below the 200 DMA to give the chart space to flex. If the 200 doesn't hold it, it's probably a good place to let someone else hold the stock.
Below is the recording of The Final Bar show. As Apple moved above the trillion dollar market cap, the $INDU chart closed down on the day. This led into a discussion about examining the underlying price action and how to quickly create index chartlists with just a few keystrokes.
Below is the recording of The Canadian Technician Video. This video shows some great examples of how breadth breaks down before the markets weaken.
Below is the Commodities Countdown video that walks through the concerns in the index set up right now.
If you are missing intermarket signals in the market, follow me on Twitter and check out my Vimeo Channel often. Bookmark it for easy access!
Good trading,
Greg Schnell, CMT, MFTA
Senior Technical Analyst, StockCharts.com
Author, Stock Charts for Dummies
Want to read more from Greg? Be sure to follow his two StockCharts blogs:
Commodities Countdown and The Canadian Technician


