 The Consumer Staples SPDR (XLP) has been leading the market since early May and Procter & Gamble is the largest stock in the sector (12.58%). On the price chart, PG is in the midst of a long-term trend change and the short-term trend is also turning up.
First and foremost, the long-term trend is turning up as the 50-day EMA moves above the 200-day EMA. This crossover is still in the early stages, but it is a positive sign as long as it holds.
As with XLP, PG is leading over the last four months, but lagging over the past year because it remains well below its January high. The S&P 500 SPDR, in contrast, hit a new high in late August.
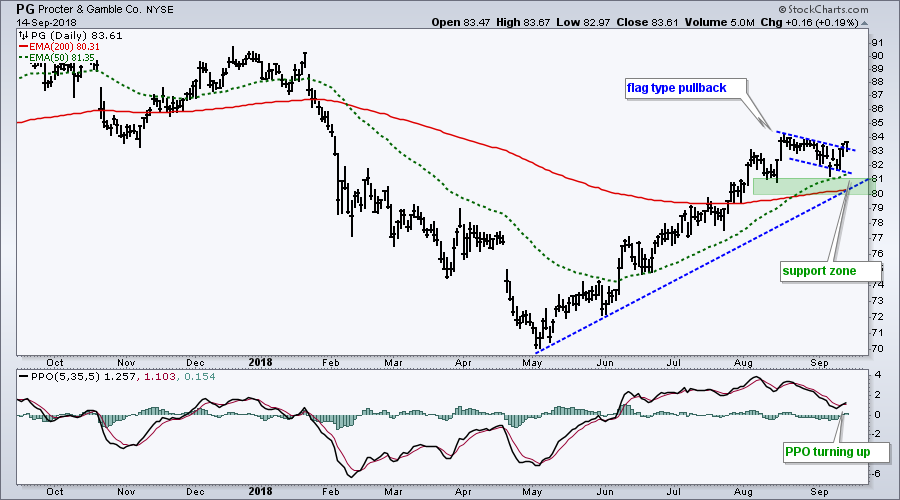
Short-term, the stock is also turning up as it breaks above the flag line with a surge the last few days. The indicator window confirms this upturn with the PPO (5,30,5) moving above its signal line.
The August-September lows and May trend line can be used to mark support in the 80-81 area. A close below 80 would break this support line, as well as the two EMAs, and call for a re-evaluation.
Plan Your Trade and Trade Your Plan.
- Arthur Hill, CMT
Senior Technical Analyst, StockCharts.com
Book: Define the Trend and Trade the Trend
Twitter: Follow @ArthurHill


