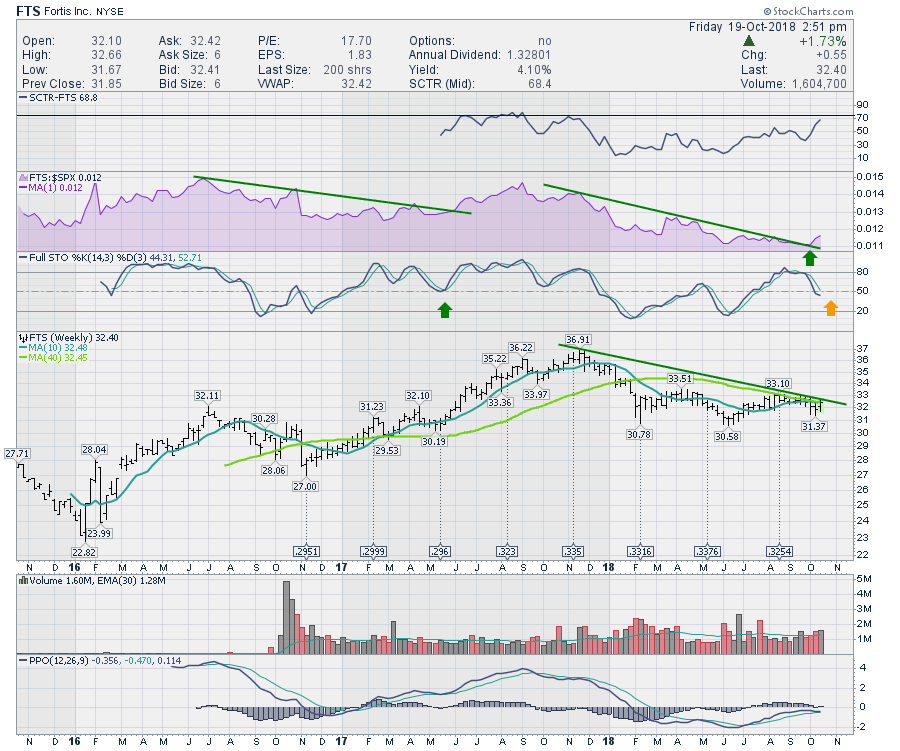
Fortis is a North American utility company that is set up quite nicely here. The annual dividend is 4% and the quarterly payment is due in November. This chart intrigues me because the setup across a lot of the pipeline and utility charts is similar. The Relative Strength is breaking a one year down trend. The SCTR ranking has been improving for the last three months and is now at 52 week highs. The down sloping price trend line is being tested today. The Full Stochastics is giving off a particularly nice setup. When the stochastic pulls back from the 80 level and bounces around 50, this can be a very bullish setup resuming the uptrend. A good example is shown in May 2017.
The Histogram on the PPO is higher this week after briefly going to zero. This little reset on the PPO is particularly nice as the stock appears to be building momentum with this higher low on the PPO. I like the volume accumulation this week as well. The nicest part of the setup is the nice tight stop just under last week's low. With the stock at the 40 Week Moving average and the 10 week moving average, this is a nice setup for a potential long candidate.
If you are missing intermarket signals in the market, follow me on Twitter and check out my Vimeo Channel often. Bookmark it for easy access!
Good trading,
Greg Schnell, CMT, MFTA
Senior Technical Analyst, StockCharts.com
Author, Stock Charts for Dummies
Want to read more from Greg? Be sure to follow his StockCharts blog:
The Canadian Technician


