Citigroup (C) is leading the Financials SPDR (XLF) lower with a lower high in September and a rising wedge break in October.
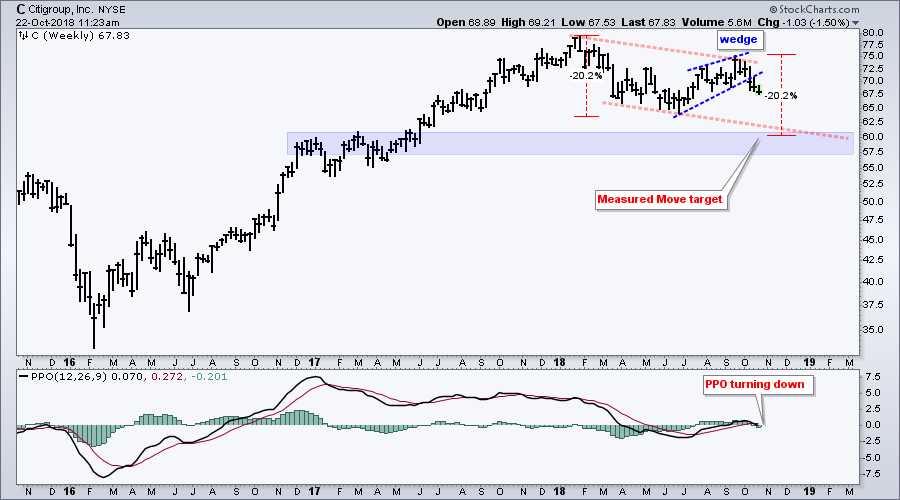
The chart shows weekly bars for Citigroup over the last three years. The stock led the market higher in 2016 and 2017 with a gain exceeding 100% from low to high. This big bank turned into a laggard in 2018 because it never challenged its January high and formed a lower high in September.
The summer bounce to the 75 area formed a rising wedge and these patterns are typical for counter trend rallies. C broke the lower trend line and the August low over the last three weeks to signal an end to the counter-trend bounce and a continuation of the bigger downtrend. Also notice that the PPO moved below its signal line and into negative territory.
There are three techniques that chartists can use to project a downside target. First, a lower trend line can be drawn parallel to the upper trend line and extended. Second, the measured move technique would project a decline similar to the first, which was 20%. Third, chartists can look for a prior consolidation to mark potential support. All three techniques place Citigroup in the 60 area by yearend.
Keep in mind that price targets should be taken with a grain of salt. The price target remains valid as long as the bearish thesis remains in place and chartists should continually evaluate price action.
Plan Your Trade and Trade Your Plan.
- Arthur Hill, CMT
Senior Technical Analyst, StockCharts.com
Book: Define the Trend and Trade the Trend
Twitter: Follow @ArthurHill


