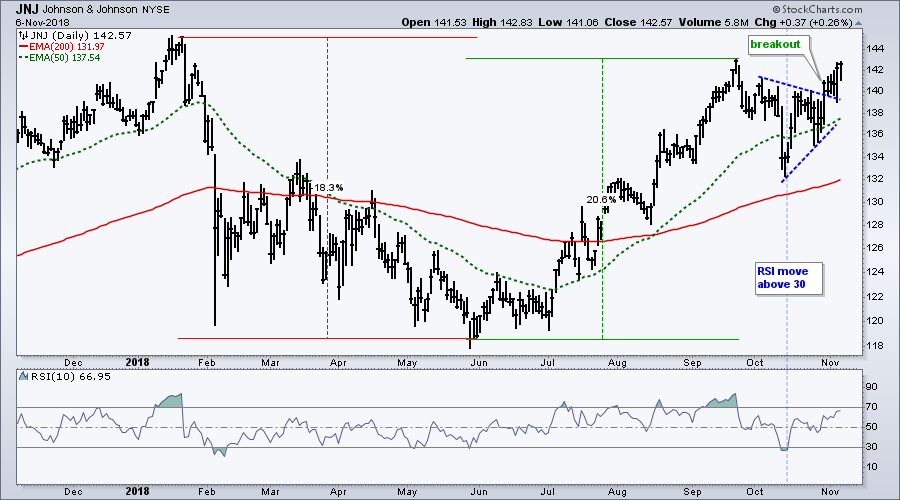
 Johnson & Johnson (JNJ) started the year on the wrong foot with a double digit decline the first six months. After hitting a 52-week low in late May, the stock turned around and advanced some 20% the next four months. Even though the stock remains below the January high, the big trend is up and this is the path of least resistance.
The chart below shows JNJ above the rising 50-day EMA and rising 200-day EMA. In addition, the 50-day EMA is well above the 200-day EMA and the stock is less than 2% from a 52-week high.
JNJ caught my eye because it recently bounced from oversold levels and broke out of a consolidation. The blue lines show a contracting range in October and the stock broke out of this "triangle" with a surge above 140 last week. This breakout ends of the consolidation, signals a resumption of the bigger uptrend and targets a move to new highs.
On Trend on Youtube
Available to everyone, On Trend with Arthur Hill airs Tuesdays at 10:30AM ET on StockCharts TV and repeats throughout the week at the same time. Each show is then archived on our Youtube channel.
Topics for Tuesday, October 31st:
- Minding Gaps and Bounces ($SPX, $MID, $SML)
- Sector Overview (Comparing the Bounces)
- Is this Chart "On Trend?" (SOXX, IBB, IHF, IHI)
- Bonds, Gold, Dollar, and Oil
- Click here to Watch
Plan Your Trade and Trade Your Plan.
- Arthur Hill, CMT
Senior Technical Analyst, StockCharts.com
Book: Define the Trend and Trade the Trend
Twitter: Follow @ArthurHill


