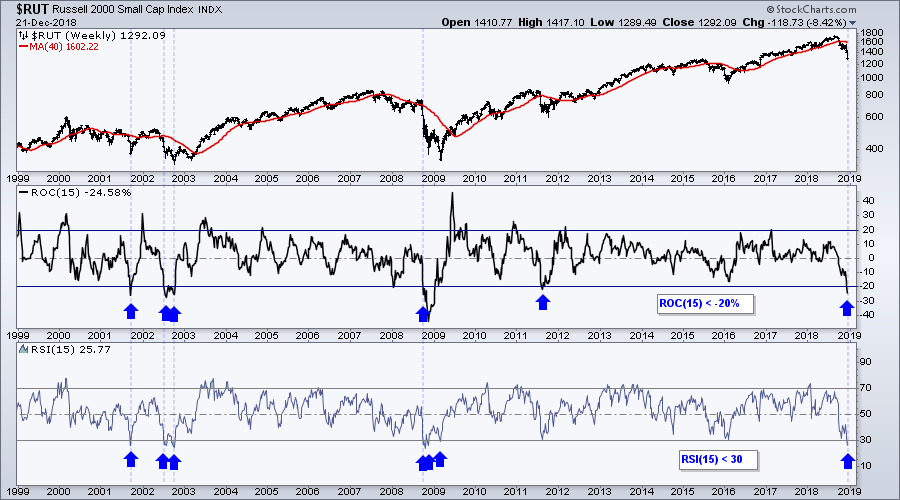
 The Russell 2000 peaked at 1740 in mid August and fell below 1300 over the last 15 weeks. The index is now down 11 of the last 15 weeks and extremely oversold. Even though the long-term trend is clearly down, this extreme oversold condition could give way to a counter-trend bounce.
The chart shows the Russell 2000 falling below its 40-week moving average in mid October and recording a 52-week low in mid December. The breakdown and new low confirm the long-term downtrend.
The indicator windows show the 15-week Rate-of-Change and 15-week RSI. I chose 15 periods for both indicators because the current decline covers 15 weeks. Thus, these indicators capture the entire decline and we can compare it to other 15-week periods. The Rate-of-Change exceeded -20% for the sixth time in the last 20 years and RSI moved below 30 for the seventh time. Clearly, these are rare occurrences.
Even though such oversold conditions pave the way for a bounce, keep in mind that oversold is a double-edged sword. Oversold conditions are long-term bearish because they reflect strong downside momentum, but they can be short-term bullish because the market has reached an extreme. Also keep in mind that timing an oversold bounce is very tricky because the longer-term trend is still the dominant force at work.
On Trend on Youtube (2 Videos)
The first video is a review of some big technical events in 2018. There were few gainers in 2018 and lots of losers. In addition, several key groups moved from 52-week highs to 52-week lows in just a few months. The second video provides a preview of what to watch as we head into 2019. Note that this is NOT a forecast.
2018 Review: Tuesday, December 18th:
- Global Overview with 7 PerfChart Groups
- New High to New Low in Just a Few Months
- Evolution of New Lows from October to December
- Underperformers Throughout 2018
- Three Themes Affecting the Financial Markets
- Click here to Watch
2019 Preview: Thursday, December 20th:
- 12 Breadth Indicators to Monitor
- Volatility has Yet to Spike
- Defensive Groups Not Immune
- Treasuries Bid for Big Reversals
- Monitor Trends and Benchmark Levels
- Pockets of Strength to Watch in 2019
- Click here to Watch
- Arthur Hill, CMT
Senior Technical Analyst, StockCharts.com
Book: Define the Trend and Trade the Trend
Twitter: Follow @ArthurHill


