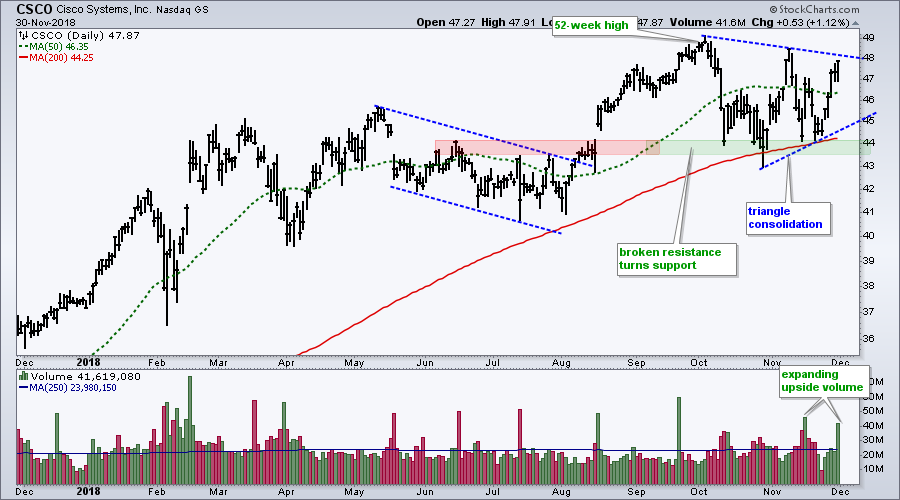
 Relative strength, an uptrend and a bullish continuation pattern point to higher prices for Cisco (CSCO). First and foremost, Cisco is in a long-term uptrend. The stock recorded a 52-week high in early October, the 50-day SMA is above the 200-day SMA and price is above the 200-day.
Second, Cisco held up better than the S&P 500 and the Technology SPDR during the recent pullback. Both $SPX and XLK broke below their 200-day SMAs, but CSCO held this moving average in late October and again in late November. In addition, CSCO formed a higher low from late October to late November as $SPX and XLK formed lower lows during this period.
CSCO traced out a triangle the last two months as broken resistance in the 43.5-44 area turned into support. The stock bounced off this zone at least three times over the last two months. With the higher low in November, a triangle formed and this is a bullish continuation pattern. A breakout would signal a continuation higher and target new highs.
The indicator window shows upside volume expanding with two big volume surges in the last three weeks. Even though volume is just an indicator, it adds to the bullish picture.
Plan Your Trade and Trade Your Plan.
- Arthur Hill, CMT
Senior Technical Analyst, StockCharts.com
Book: Define the Trend and Trade the Trend
Twitter: Follow @ArthurHill

