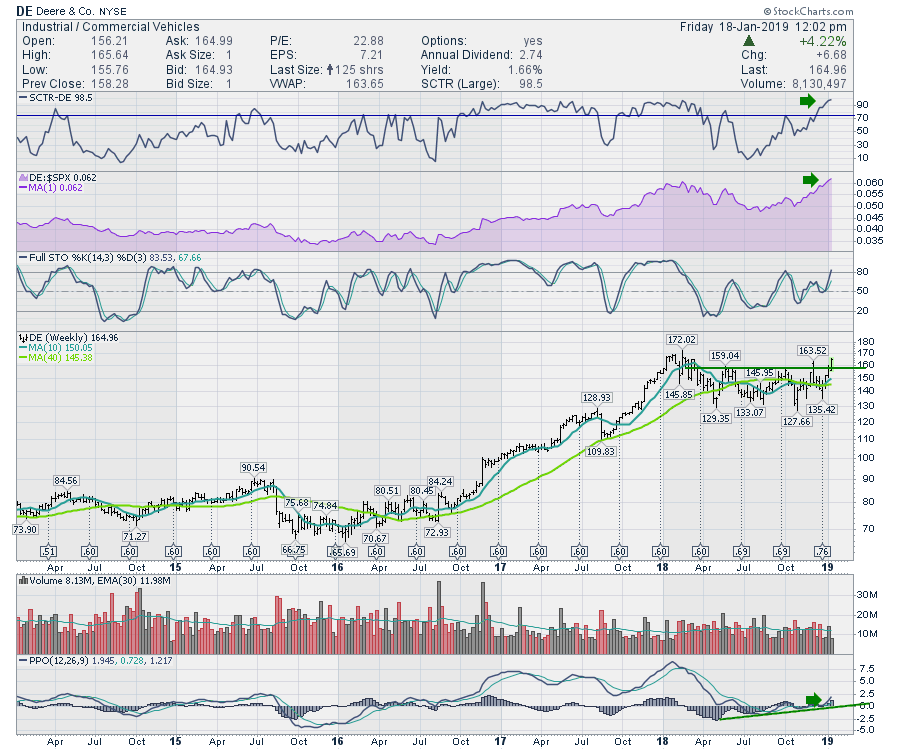
There's been a nice surge in the Commercial Vehicles group over the past month. One of the leaders in the group is Deere & Co. (DE) which outperformed all of 2017 and consolidated through 2018. This week's price action on Deere looks like the highest weekly close in 9 months - and there are a few other technical clues that suggest there is more to come.
In November 2016, Deere broke out to a new 12-month relative strength highs compared to $SPX. That initial clue started Deere on a run, doubling the stock price. It continued to outperform - the SCTR ranking shows Deere staying above 75 for most of the next 18 months. With the exception of the one down week in mid-summer 2017, it was a straight uptrend for Deere.
The same setups are showing up on the chart again. With the PPO making higher lows and moving back above zero, the stock looks set to run as momentum increases.
 Within the Commercial Vehicles group, there are some great-looking charts. Check out Wednesday's Market Buzz below for some of the nice charts within the group - Deere is just one within a great-looking industry group setup.
A lot of charts are changing this week. If you are looking for some positive areas of the market to investigate, I would strongly encourage you to look at my Weekend Wrap!
Check out the Wednesday edition of my new show Market Buzz! Market Buzz will be live on StockCharts TV Wednesday and Friday mornings at 10:30 ET (7:30 AM PT). Please join me for a longer-timeframe investing outlook.
If you would like to learn more about the basics of charting, check out Stock Charts for Dummies. The first section of the book walks through all the chart settings to get the charts you want, the second section explores why you might use charts for investing and the third section is about putting it all together.
Click here to buy your copy of Stock Charts For Dummies today!
If you are missing intermarket signals in the market, follow me on Twitter and check out my Vimeo Channel. Bookmark it for easy access!
Good trading,
Greg Schnell, CMT, MFTA
Senior Technical Analyst, StockCharts.com
Author, Stock Charts for Dummies
Hey, have you followed Greg on Twitter? Click the bird in the box below!
Want to read more from Greg? Be sure to follow his StockCharts blog:
The Canadian Technician


