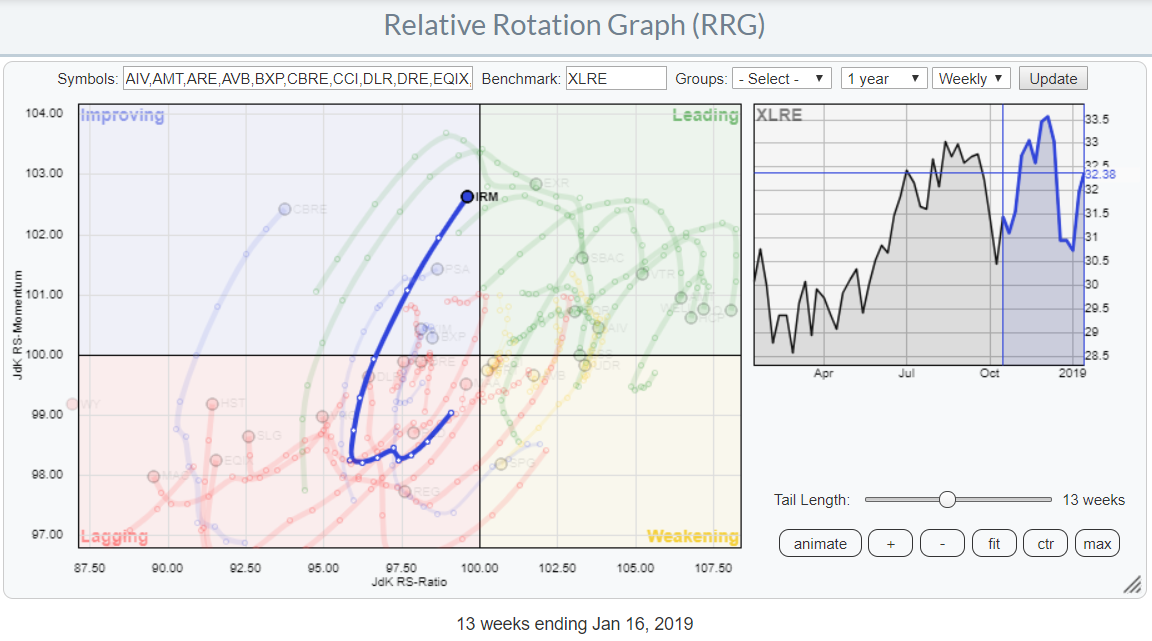
 The Relative Rotation Graph above highlights the rotation of IRM (Iron Mountain Inc.) in comparison to the other stocks in the S&P Real-Estate sector (XLRE).
The sector itself is interesting to keep an eye on as it is positioned well inside the leading quadrant but rolling over, at high JdK RS-Ratio levels, on the weekly RRG. But it is inside the lagging quadrant and curling up on the daily RRG.
This setup suggests a longer-term (weekly chart) relative uptrend that goes through a pause/correction (daily chart). Assuming that the weekly trend is providing the long-term framework, the rotation through lagging on the daily RRG could be a good point to start looking for re-entry and find interesting stocks within the sector to play.
As IRM is a Real-Estate stock, which usually means high dividend impact, I prefer an unadjusted price chart to look for support/resistance and trendlines.
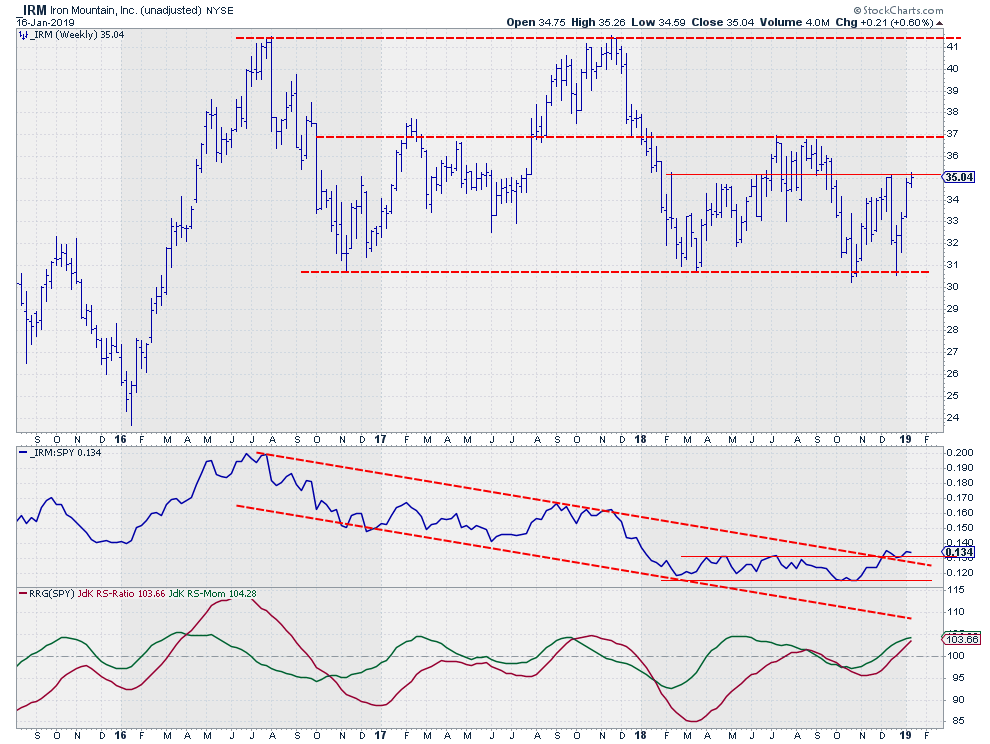 On this, weekly, chart IRM is running into an intermediate horizontal resistance level near $35 at the moment. The next more meaningful barrier will be around $37. An upward break of that level will free the way for a further advance to the previous peaks just above $41.
The strong rotation of IRM on the weekly Relative Rotation Graph above suggests support from a relative perspective which can also be seen in the raw RS-Line that is trying to break out of a 2.5-year downtrend and a nine-month trading range since December.
If this scenario works out then a solid close above $35 by the end of this week will be the trigger for a move towards $37. And a subsequent weekly close above $37 will trigger the next leg to $41.
My regular blog is the RRG blog If you would like to receive a notification when a new article is published there, simply "Subscribe" with your email address using the form below.
Julius de Kempenaer | RRG Research
RRG, Relative Rotation Graphs, JdK RS-Ratio, and JdK RS-Momentum are registered TradeMarks ®; of RRG Research
Follow RRG Research on social media:
Feedback, comments or questions are welcome at Juliusdk@stockcharts.com. I cannot promise to respond to each and every message but I will certainly read them and where reasonably possible use the feedback and comments or answer questions.
If you want to discuss RRG with me on SCAN, please use my handle Julius_RRG so that I will get a notification.


