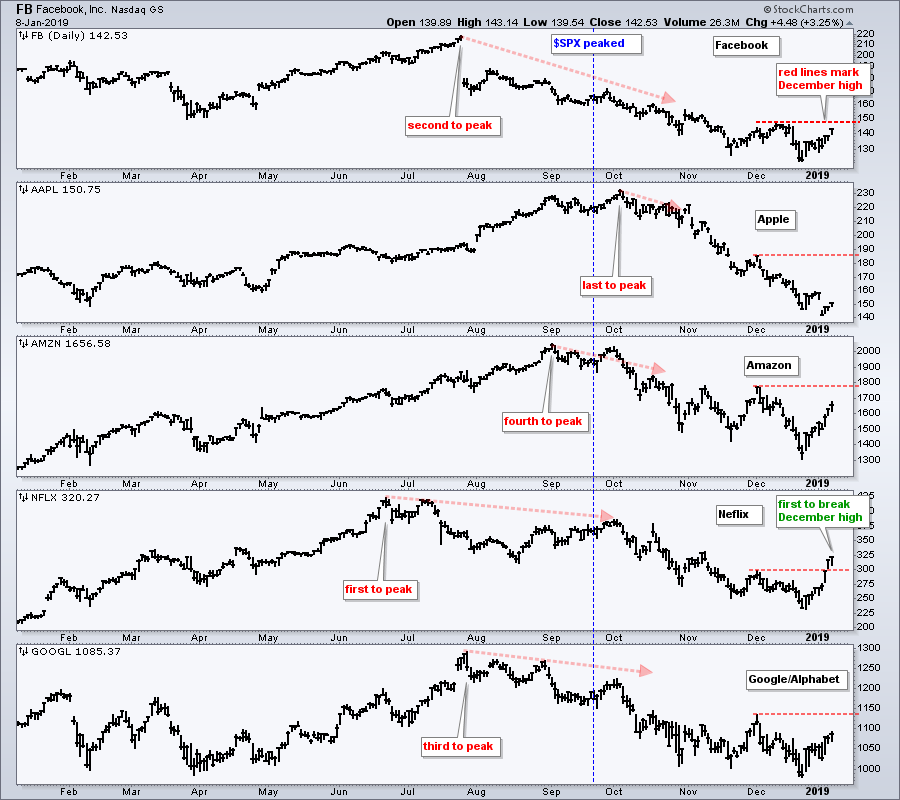
 Netflix was the first of the five FAANG stocks to peak in June 2018 and is now the first of the five to break its December high. Thus, Netflix is leading the FAANGs here in January because it is the only one with a higher high. Note that Netflix reports earnings next week (January 17th).
The price chart below shows when all five peaked in the summer-fall. Netflix was first in June, Facebook and Alphabet followed in July, Amazon peaked in early September and Apple was the last to peak in early October. The vertical blue line marks the peak in the S&P 500 for reference. Google had the smallest peak to trough decline of the five (~25%) and Netflix had the largest (~46%).
The red horizontal lines mark the December highs for each stock. These are "benchmark" highs that chartists can use to compare performance. For reference, the S&P 500 is still around 8% below its December high. The bottom window shows Netflix breaking above its December high and this shows both relative and absolute "chart" strength. Also note that Facebook is quietly outperforming the other three because it is the closest of the other four to its December high.
On Trend on YouTube
Methods to Measure a Breadth Thrust
- Zweig, Appel and Hill Breadth Thrusts
- Marking First Resistance for SPY and QQQ
- Watch %above 20-day EMA for Overbought
- 8 Bearish Setups and 8 Bullish Setups
- 8 IBD-50 Stocks with Bullish Setups
- Click here to Watch
- Arthur Hill, CMT
Senior Technical Analyst, StockCharts.com
Book: Define the Trend and Trade the Trend
Twitter: Follow @ArthurHill


