This rally has been great, lifting portfolios around the world. With lots of optimism helping the market here, there are some worldwide charts that I reviewed on the Weekly Market Roundup show. There is a link to the video further down in this article.
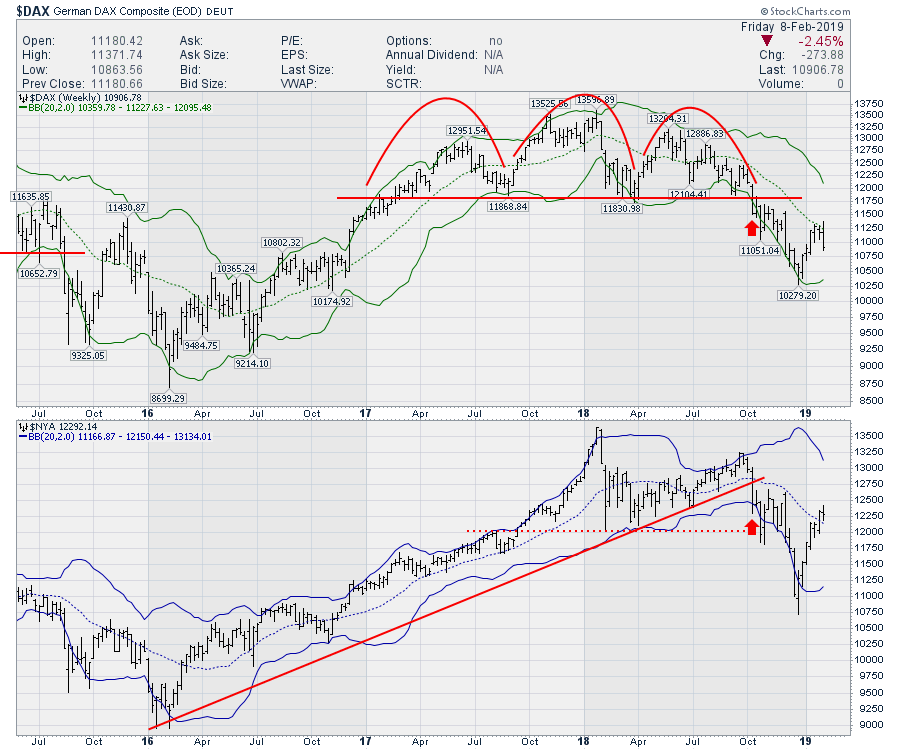
Back in October (see the red arrows on the chart below), I mentioned that the German stock market was breaking down in a pattern that we have seen before. This breakdown coincided with USA charts breaking down in October 2018, with the first bar breaking below support on the $DAX and the US market breaking the trend line. Here is a link to the article in question: Zooming Out - Is A Major Market Top In? October 15th, 2018.
In the article, I discussed how global markets were very weak and that the breakdown in Germany, coinciding with the break in the US market trend line, has happened before. This coincidental breakdown was excellent global timing for standing aside. The charts posted in the article were from the first week that the $DAX broke its support line. Now, the $DAX has returned to the 20-week moving average, shown on the chart as a dotted green line. The USA NYSE Composite (all of the stocks on the New York Stock Exchange) is marginally above the 20-week moving average. Currently, the $DAX is making a 3-week low, which could be the start of a rollover. So is this helpful or irrelevant?
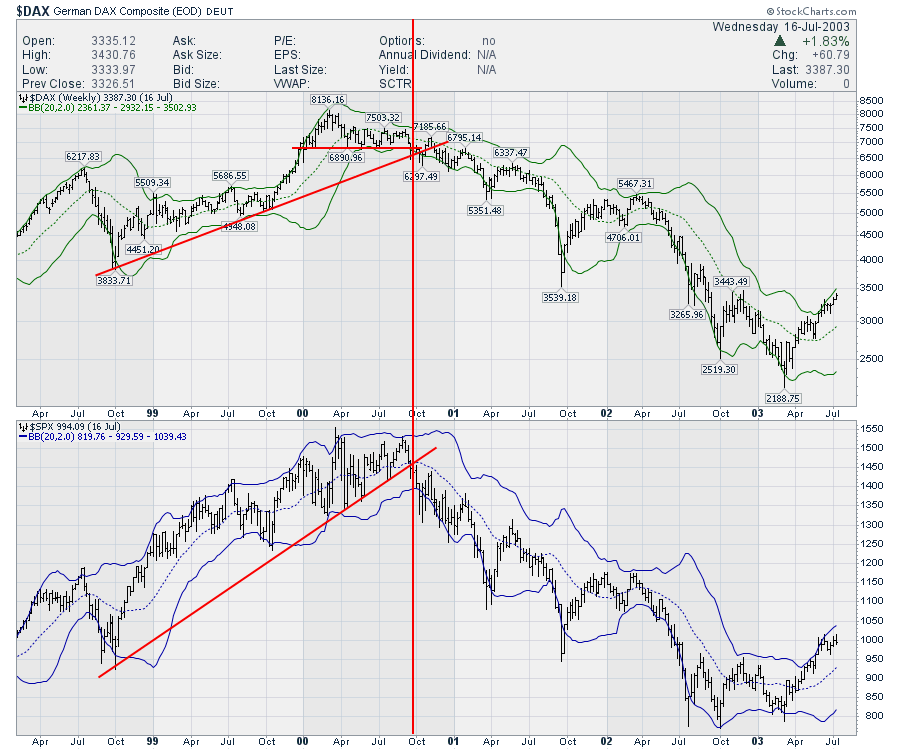
 Well, if we look back at previous market tops like in 2000-2003, both stalled around the 20-week moving average. The first 3-week low was not bad timing in October 2000.
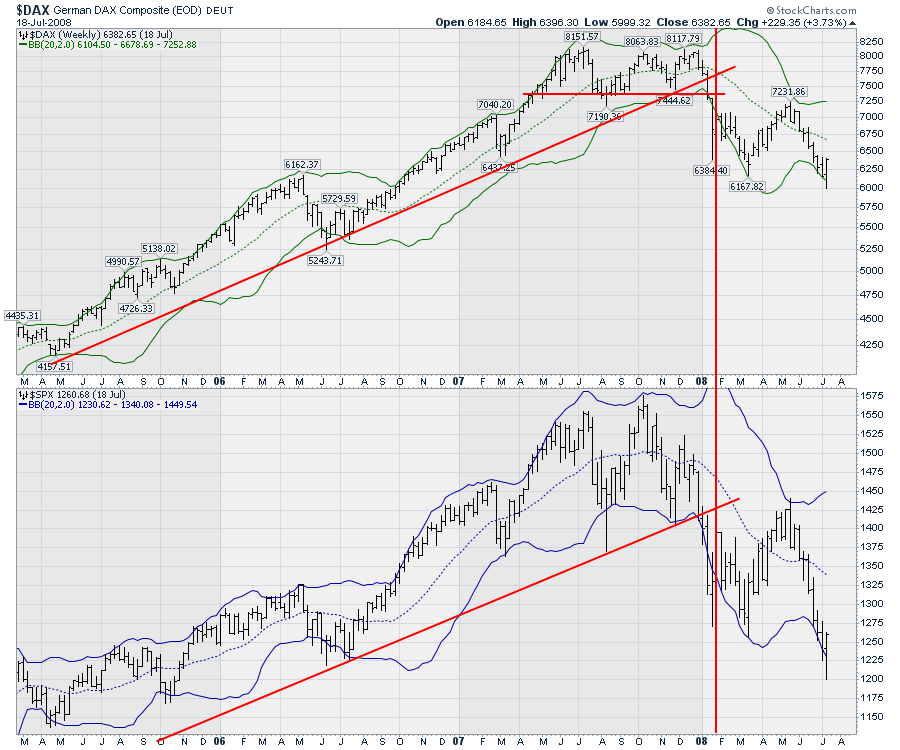
 In 2007-2009, they spent a few weeks above the 20-week moving average. The first 3-week low was not bad timing, a clue for the end of the rally in May 2008.
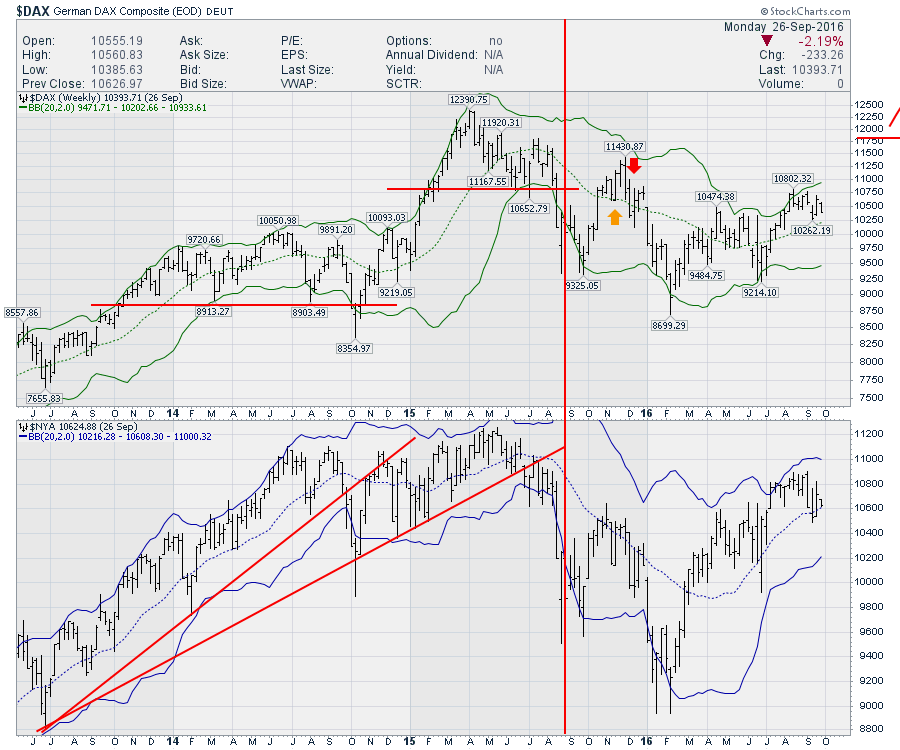
 In 2015, the German market made a 3-week low without the USA (orange arrow). Both Germany and the US went on to rally for two more weeks, then rolled over hard (red arrow). The final top was just as the US market moved above the 20-week moving average.
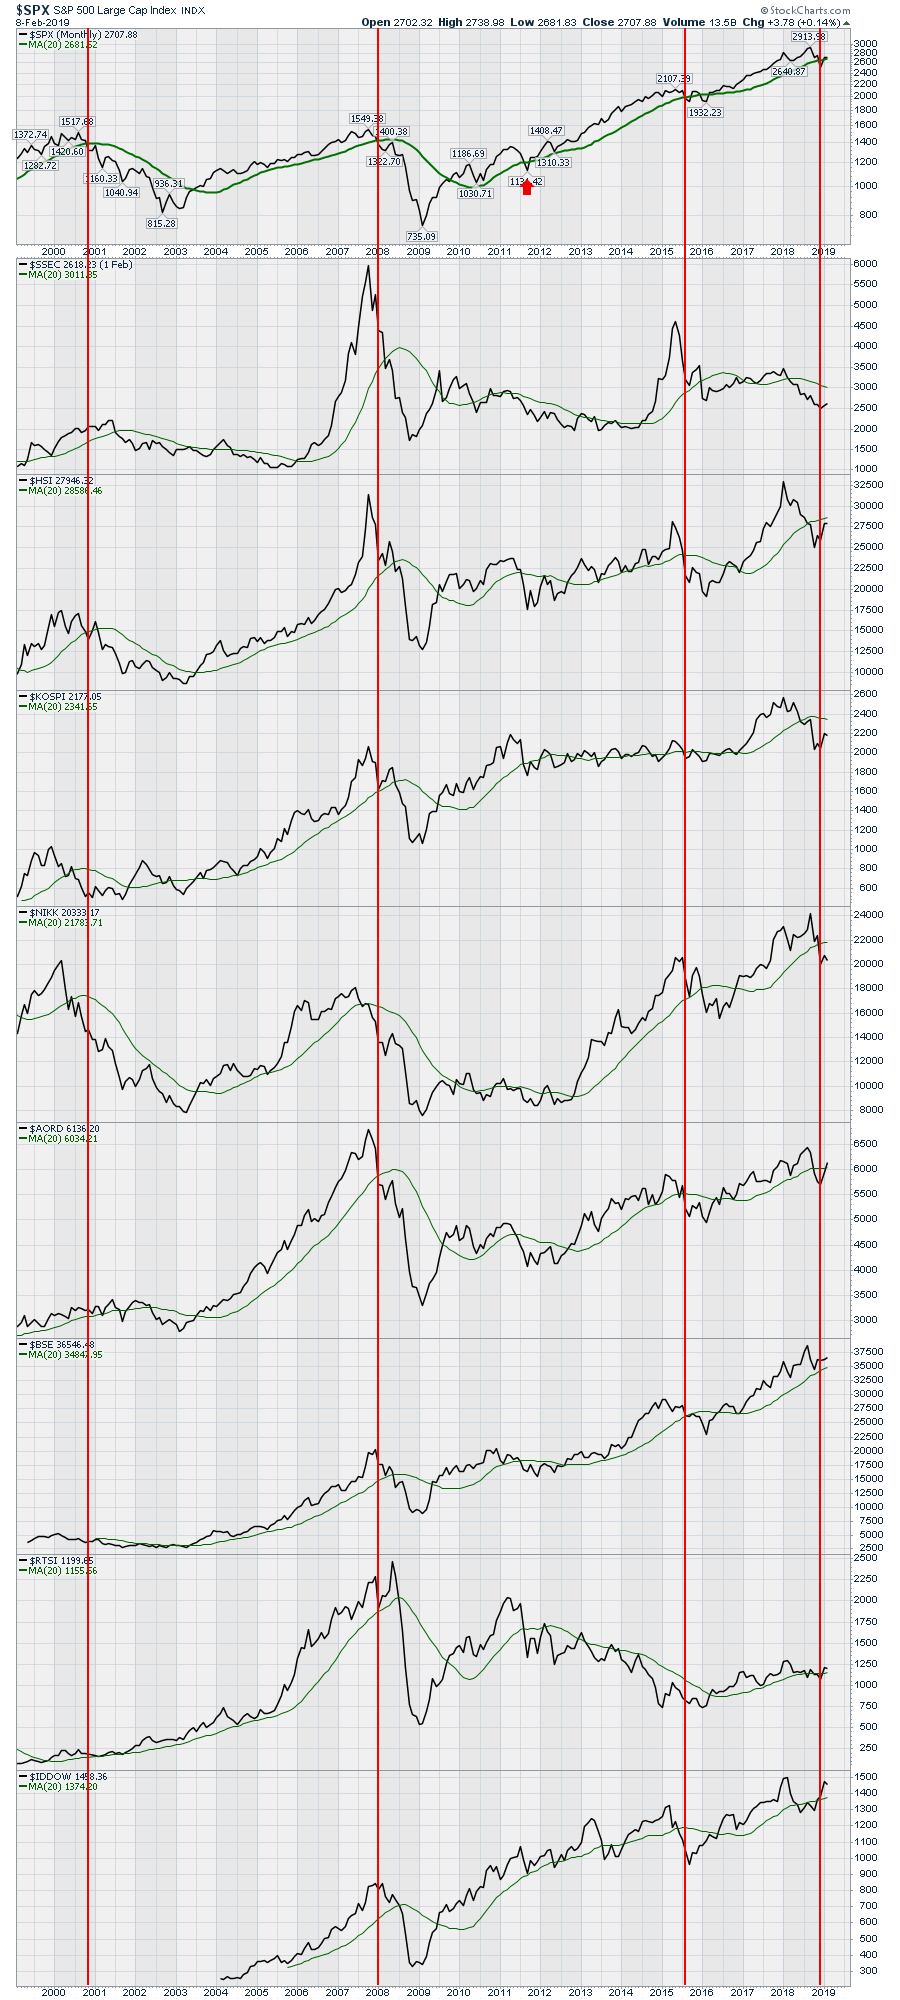
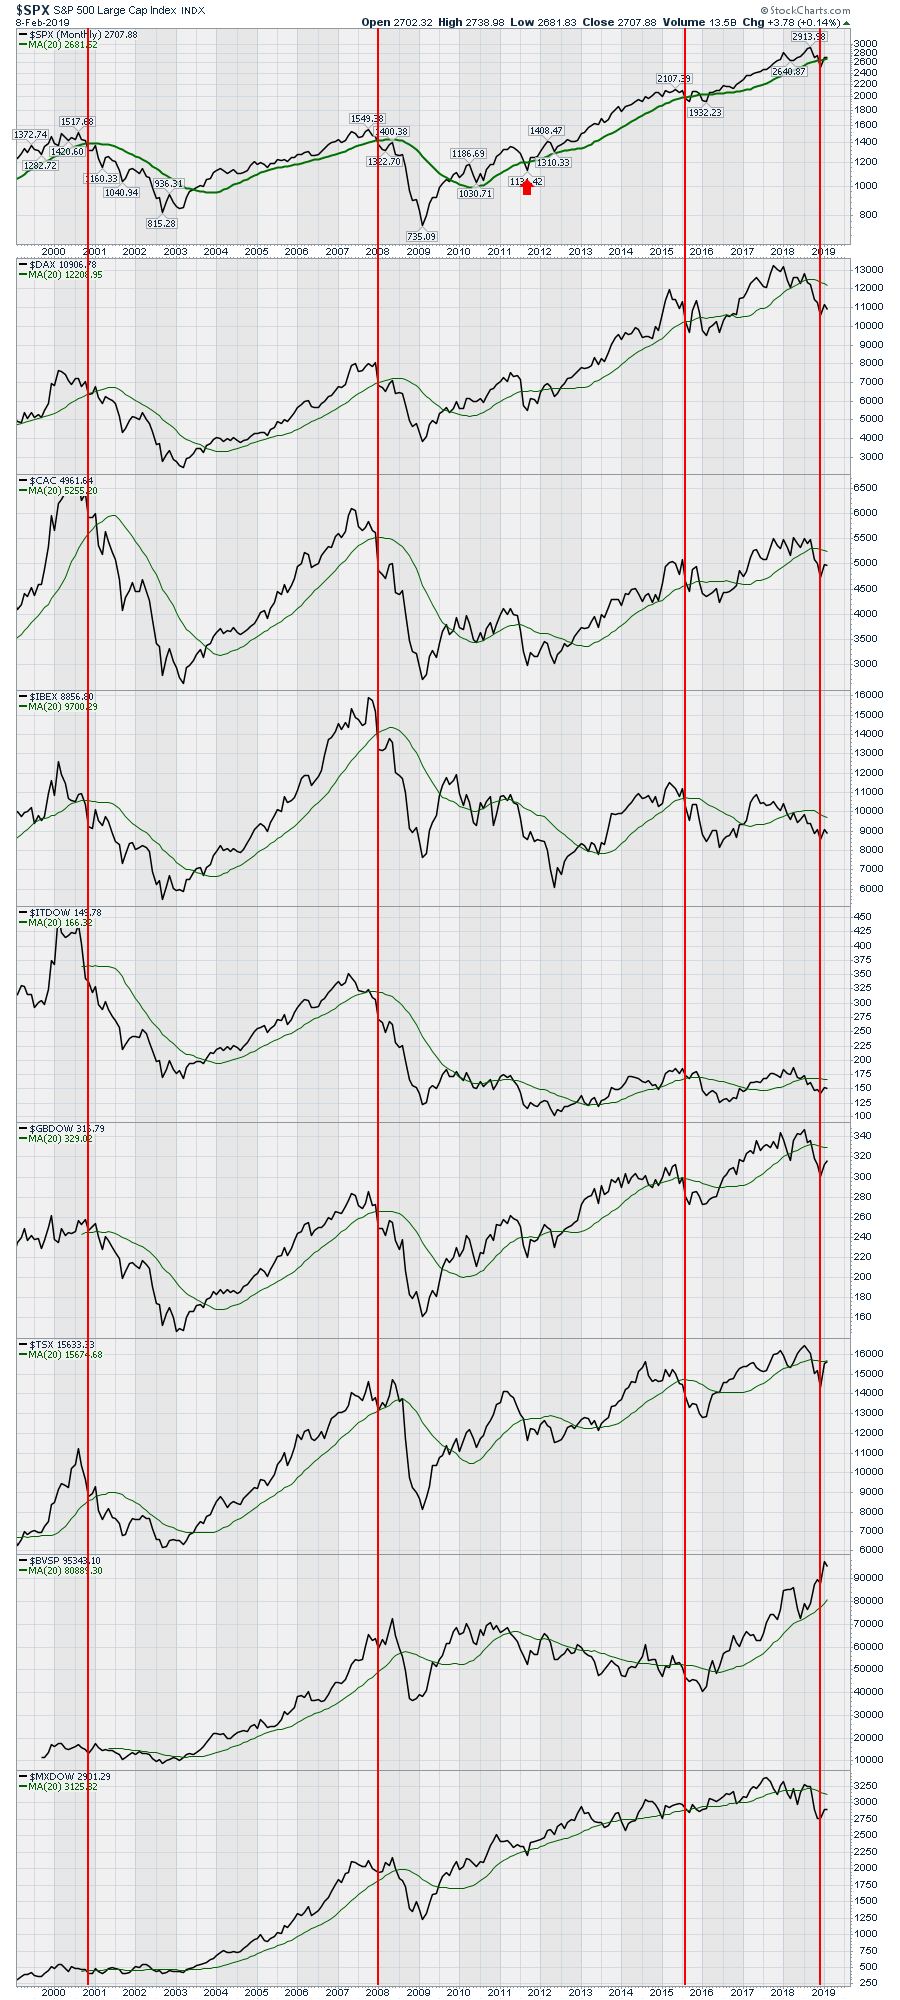
 While Germany is just one market, there are lots of breakdowns out there. In the October 2018 article, I had two vertical charts comparing some notable world markets. Here are those two charts updated to the current level, including the big rally. 11 of those 17 markets are still below the 20-month moving average, including major trading partners like Germany, France, Canada, UK, Mexico, China and Japan.
 Here's a chart looking at east Asian countries.
All this is to say it's not just Germany. History doesn't necessarily repeat exactly, but it often rhymes. There are some powerful charts worth looking at in this article: Give Your Charts A Shake 2019-02-09.
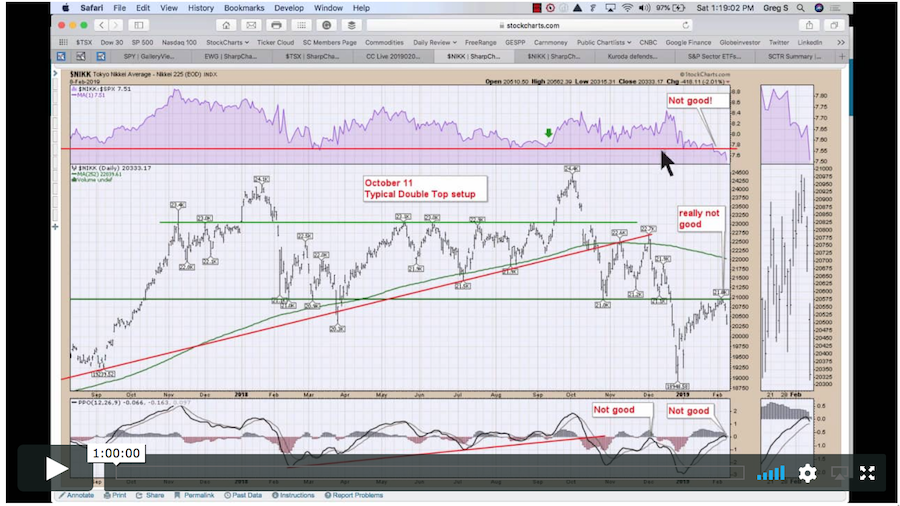
For more, check out this week's Weekly Market Roundup video! There is a conversation about the global markets and the precarious setups they are in, while the last 5 to 10 minutes discusses the $USD and other currencies. I am watching for confirmation from currencies, bonds and global markets, which may converge to show their direction over the next few weeks.
Last week, I discussed the bond setup as being attention-getting. This week, it continued to build on the setup. I would encourage you to watch last week's video here.
You can find the Wednesday Edition of Market Buzz by clicking on the video below.
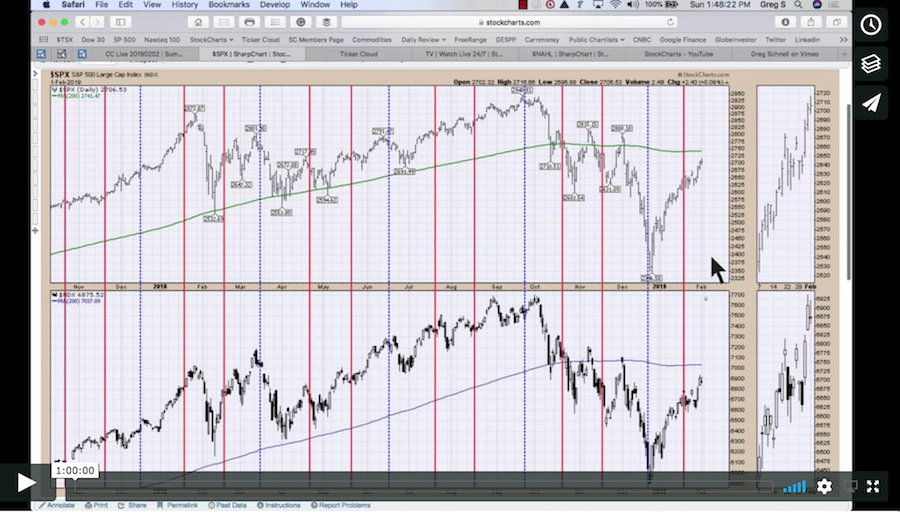
 Friday's installment covered some of the things Greg checks to investigate market health.
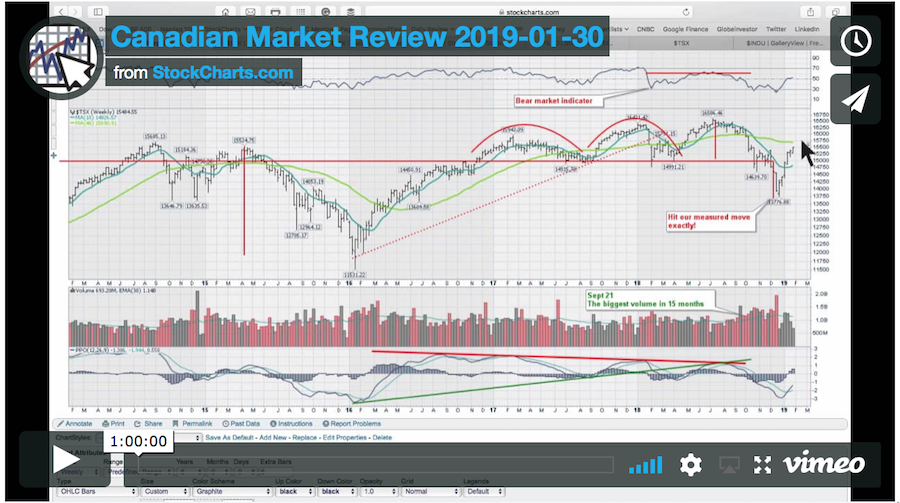
 Here is the latest Canadian Technician video about the Canadian Markets.
If you would like to learn more about the basics of charting, check out Stock Charts for Dummies. The first section of the book walks through all the chart settings you need to help you get the charts you want, the second section explores why you might use charts for investing and the third section is about putting it all together.
Click here to buy your copy of Stock Charts For Dummies today!
If you are missing intermarket signals in the market, follow me on Twitter and check out my Vimeo Channel. Bookmark it for easy access!
Good trading,
Greg Schnell, CMT, MFTA
Senior Technical Analyst, StockCharts.com
Author, Stock Charts for Dummies
Hey, have you followed Greg on Twitter? Click the bird in the box below!
Want to read more from Greg? Be sure to follow his StockCharts blog:
The Canadian Technician

