Chartists looking for the sectors with the most stocks in strong uptrends can turn to the High-Low Percent indicators. High-Low Percent equals new 52-week highs less new 52-week lows divided by total issues. This indicator is positive when new highs outnumber new lows and negative when new lows outnumber new highs. The more positive the indicator, the more new highs and the more internal strength.
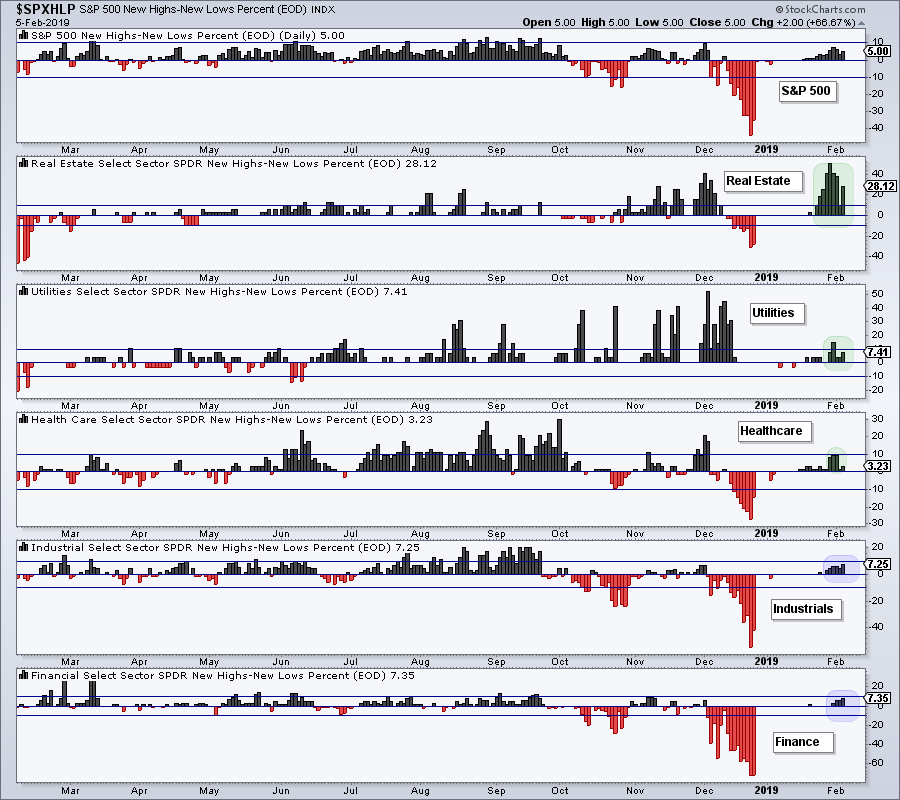
The chart below shows S&P 500 High-Low% ($SPXHLP) in the top window and the High-Low Percent histograms for the top five sectors, as ranked by the 5-day average of High-Low Percent. Note that the 5-day SMA is not shown to keep the chart clean. Only three sectors stand out: REITs, Utilities and Healthcare. These three stand out because their High-Low Percent values reached or exceeded the +10% threshold over the last five days (green zones).
Industrials High-Low% ($XLIHLP) and Finance High-Low% ($XLFHLP) have been positive the last few days, but both are short of the 10% threshold, which I deem important. A move above +10% shows enough "critical mass" to support an uptrend in the sector. These two are close, but no cigar just yet. Note that S&P 500 High-Low% is also short of the +10% threshold.
Here are the 12 symbols for High-Low Percent: $XLKHLP ,$XLFHLP ,$XLIHLP ,$XLCHLP ,$XLYHLP,$XLBHLP ,$XLEHLP ,$XLUHLP ,$XLREHLP ,$XLPHLP ,$XLVHLP
On Trend on YouTube
To Chase or Not to Chase
- Reviewing the Turn of the Month
- Two Parts to an Uptrend (AMZN, CIEN)
- HACK and SKYY Lead Tech ETFs
- Six Healthcare Leaders (MRK, PFE, ABT...)
- Four Teetering Tech Titans (GOOGL, MSFT...)
- Stocks to Watch (ULTA, WING, TER...)
- Click here to Watch
- Arthur Hill, CMT
Senior Technical Analyst, StockCharts.com
Book: Define the Trend and Trade the Trend
Twitter: Follow @ArthurHill


