 The chart that I want to share with you today is part of a (bigger) research project that I am doing with regard to the various phases in economic cycles and their relation to the (shape of) yield curve.
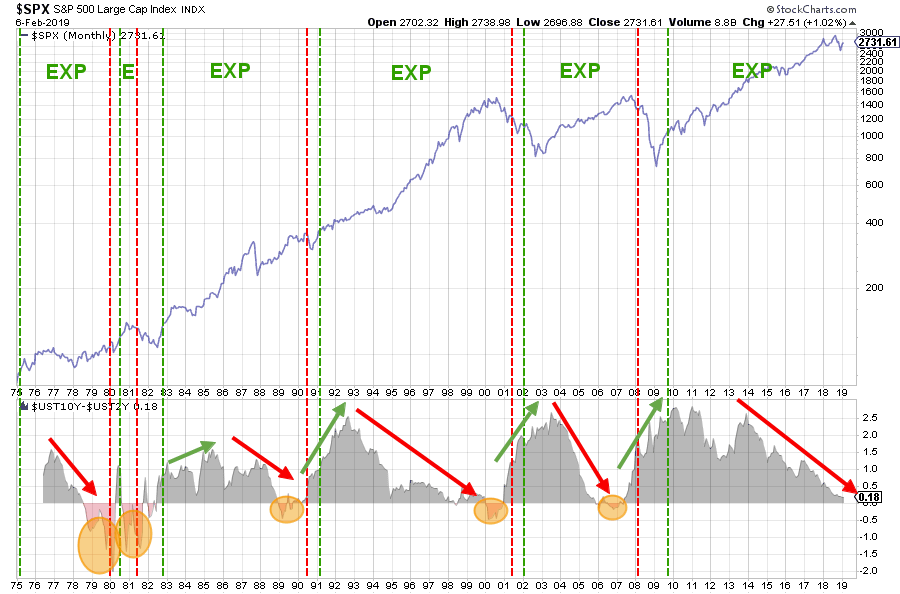
The chart above shows the S&P Index in the main panel. The panel below shows the difference between 10yr and 2yr yields on US treasuries. This 10-2 relationship is generally used to indicate a normal, 10yr > 2yr, or inverted, 10yr < 2yr, shape.
The overlaid, red and green, dashed vertical lines indicate the start of periods of Expansion and Contraction. The green dashed lines indicate the start of an Expansion period and the red dashed lines indicate the start of a contraction (recession).
These dates are coming from the National Bureau of economic research (NBER) and can be found here, in case you thought I was making these dates up ;)
The arrows on the yield curve chart indicate a steepening curve, indicated with the green arrows, or a flattening curve, indicated with the red arrows.
Just as a reminder, steepening or flattening of the curve has nothing to do with rising or falling yields it only measures the difference between the 10- and 2-year yields.
The orange shaded ovals indicate periods when the yield curve was inverted.
A few takeaways from this chart.
- Expansions generally last, a lot, longer than contractions
- The current expansion is, one of, the longest in recent history
- Yield curve inversions seem to take place just before the start of a contraction period
- At the moment, we are 18bps away from a new inversion
- A flattening curve, in general, seems to support the stock market while a steepening curve seems to have a negative impact
These are all very general, big picture, observations to help paint the picture of the current market environment.
This chart will not help you to time any entry or exit point but it makes you aware of what's happening in the grand scheme of things. And, IMHO, that awareness is crucial for making the correct investment or trading decisions.
For those reasons, it is not a chart that you need to check all day-every day but it is certainly a chart that you should not ignore.
When you click on the chart and open the live version, the chart will open including the annotations. In order to save the chart including the annotations, you need to click on the "annotate" button in the lower left corner of the chart. Then click the "save chart" button and you will be prompted to give tha chart a name and choose a chartlist. You can read all the steps in this support article.
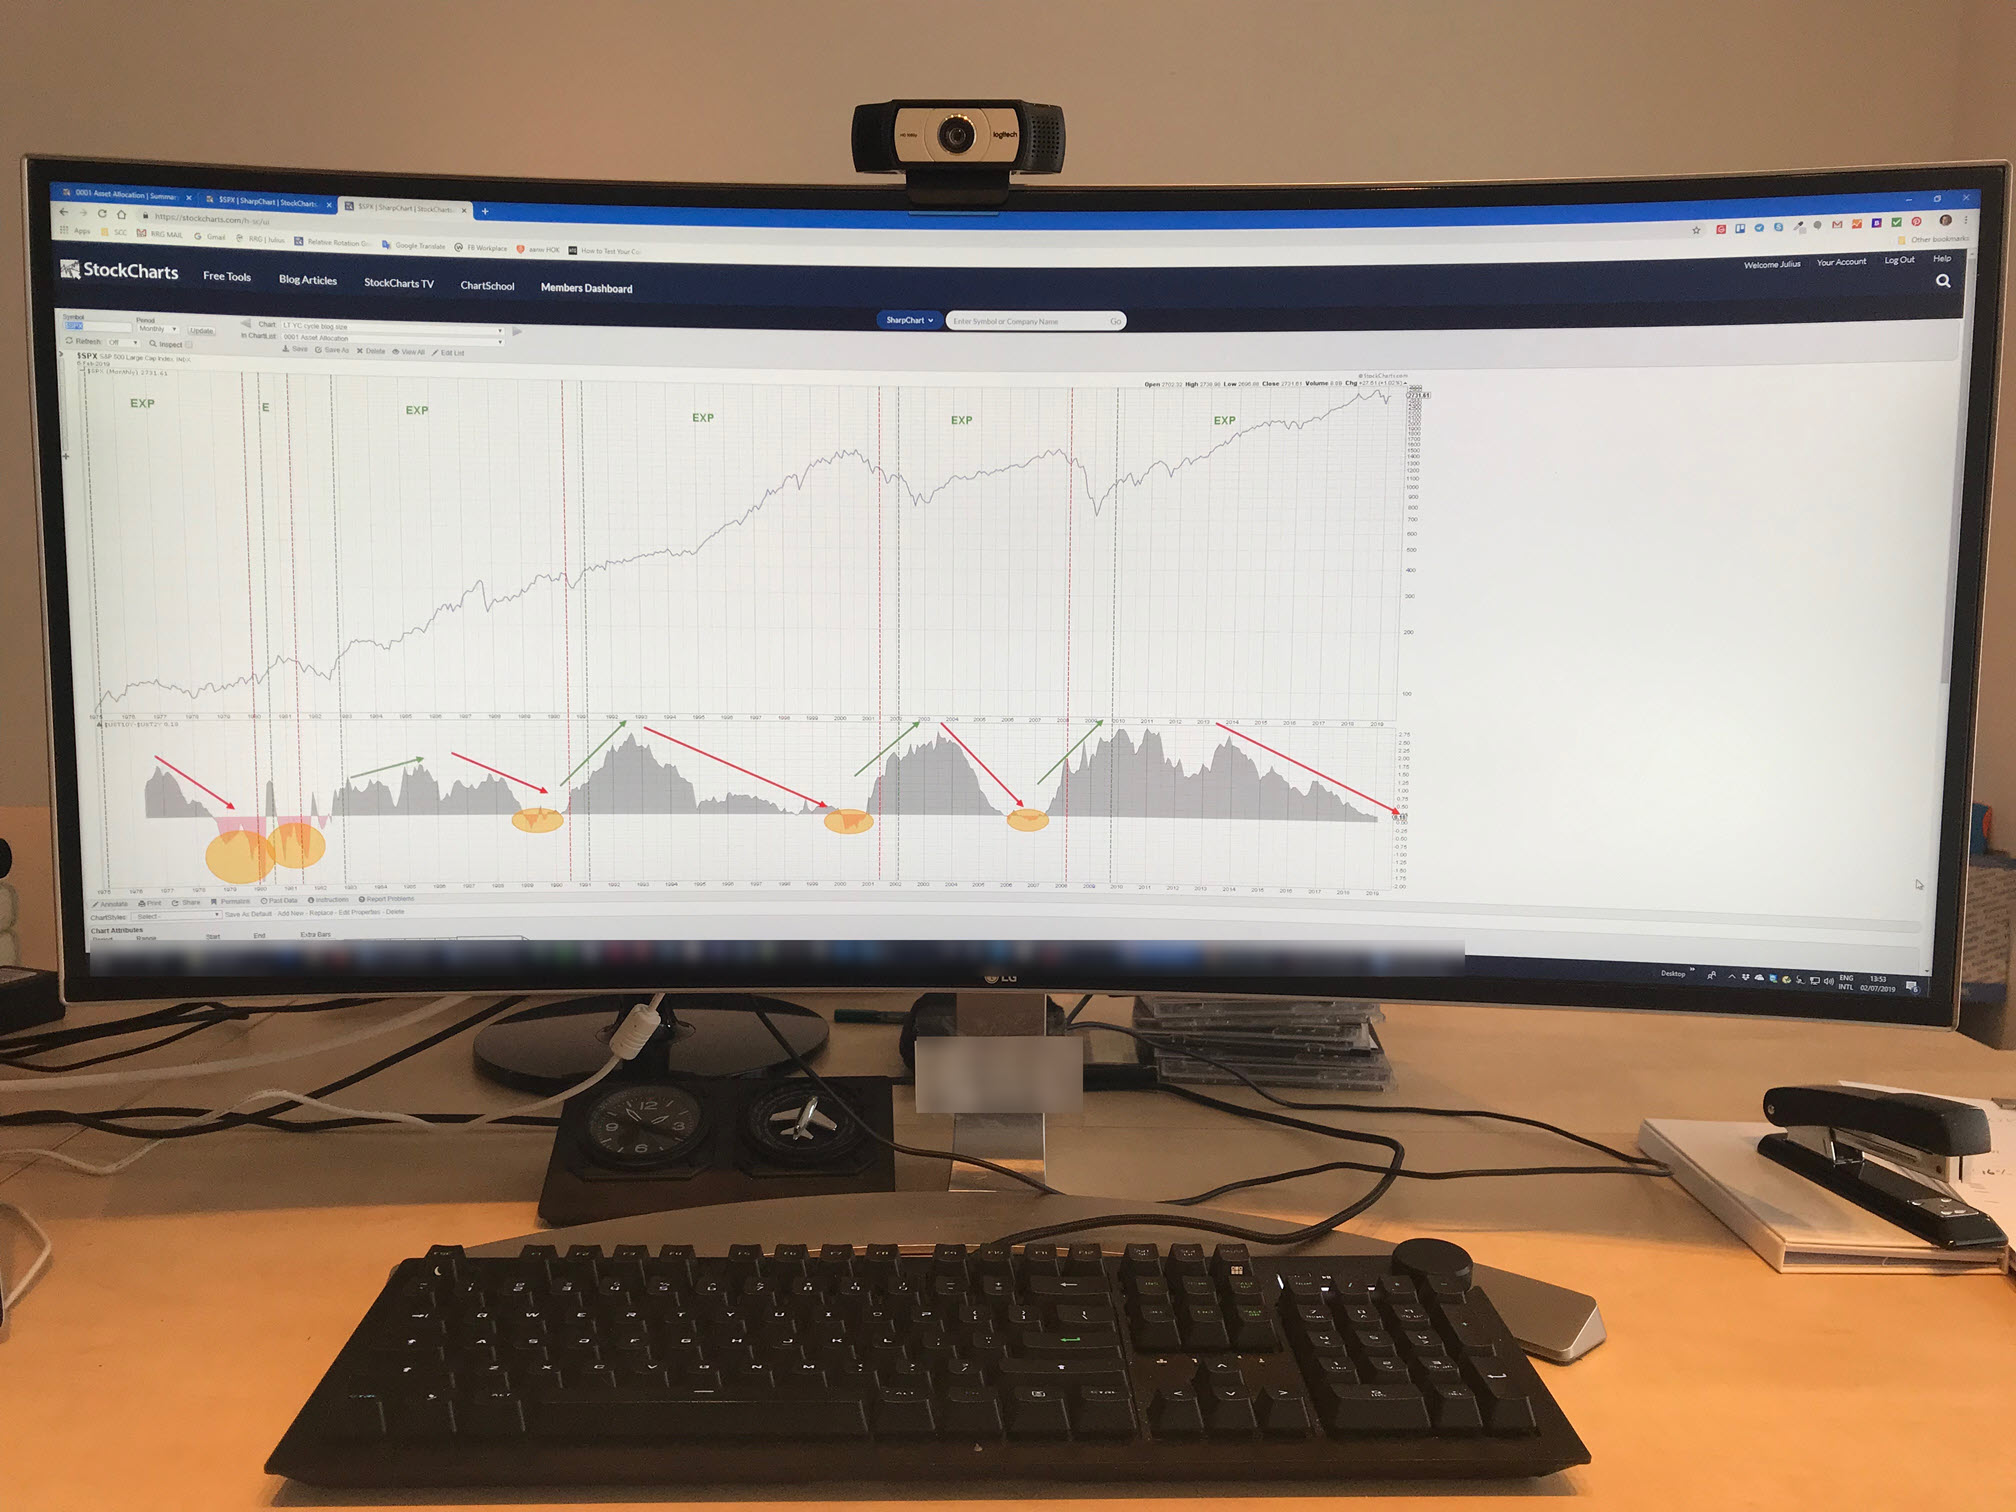 TIP: This chart lends itself very well to blow up on your screen for better inspection. The image shows the chart on my wide-screen monitor. Using the custom size settings I have set the chart to be 2500 pixels (the maximum allowed) wide and 1000 pixels high. This makes sure that the bottom of my chart does not scroll off the bottom of the screen.
My regular blog is the RRG blog If you would like to receive a notification when a new article is published there, simply "Subscribe" with your email address using the form below.
Julius de Kempenaer | RRG Research
RRG, Relative Rotation Graphs, JdK RS-Ratio, and JdK RS-Momentum are registered TradeMarks ®; of RRG Research
Follow RRG Research on social media:
Feedback, comments or questions are welcome at Juliusdk@stockcharts.com. I cannot promise to respond to each and every message but I will certainly read them and where reasonably possible use the feedback and comments or answer questions.
If you want to discuss RRG with me on SCAN, please use my handle Julius_RRG so that I will get a notification.


