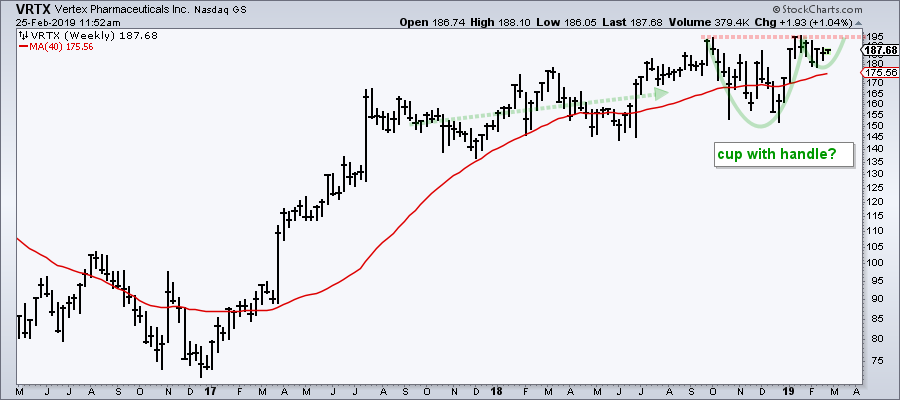
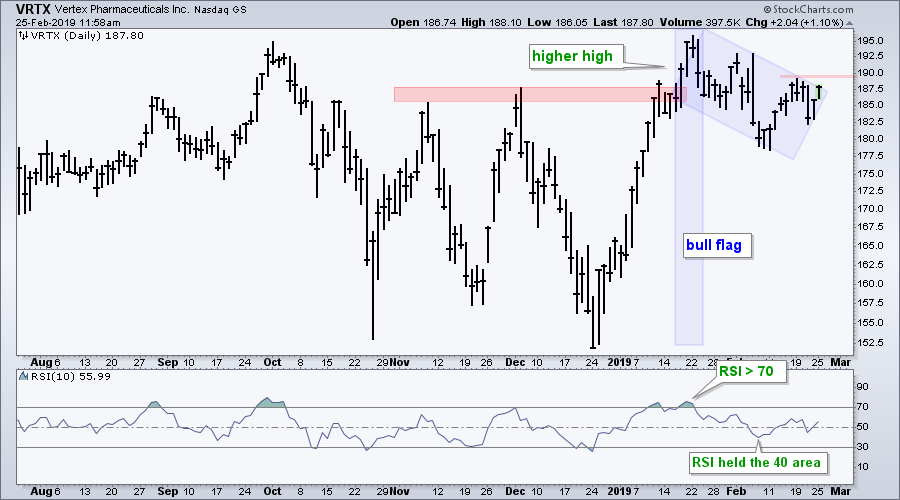
The daily chart for Vertex (VRTX) is quite a mess with several dips under the 200-day SMA over the last ten months, but a short-term bullish pattern is shaping up and the weekly chart also sports a bullish setup.
Let's look at the weekly chart first because the longer timeframe should be considered more dominant. First, VRTX is in a long-term uptrend. The stock recorded a 52-week high in January and remains above the rising 40-week SMA. A cup-with-handle appears to be forming over the last several months with neckline resistance in the 195 area. A breakout here would open the door to new highs and a continuation higher.
 The next chart shows Vertex with a bull flag forming over the last few weeks. This flag is basically the "handle" on the weekly chart. The stock surged above the November-December highs with a sharp advance in January and then corrected with a pullback to the 180 area. This correction worked off overbought conditions. A breakout at 190 would signal an end to the flag and a resumption of the advance.
The indicator window shows RSI with improving momentum. Notice that RSI moved above 70 twice in January and this shows strong upside momentum. During the flag pullback, RSI held above 40 and this shows limited downside momentum.
On Trend on YouTube
Potential Resistance versus Existing Uptrend
- Third Time Lucky for Resistance?
- Breadth/Trend Indicators Remain Strong
- Breaking Down the SPY and QQQ (top stocks)
- Bond ETFs are Winding Up (Bollinger Bands)
- XLC and XLE are the Lagging Sectors
- Tesla Seriously Underperforming Auto Group
- Click here to Watch
- Arthur Hill, CMT
Senior Technical Analyst, StockCharts.com
Book: Define the Trend and Trade the Trend
Twitter: Follow @ArthurHill


