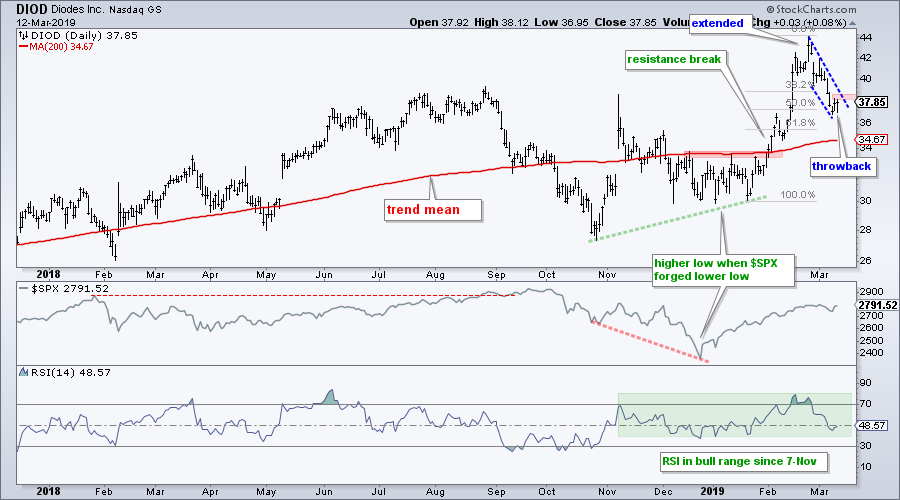
Diodes (DIOD), a semiconductor stock, is returning to the trend mean and this could provide a bullish setup to take part in the long-term uptrend.
The chart below shows DIOD with a breakout and surge to new highs in February. Note that the stock also recorded new highs in autumn 2017, summer 2018 and now winter 2019. The long-term trend has been up for over two years.
The red line marks the 200-day SMA, which can also be considered the trend mean or average. The stock has broken this average several times during its overall uptrend, but dips below this trend mean were more of an opportunity than a threat.
After hitting a new high less than three weeks ago, the stock fell back pretty hard (~15%). While I consider this a correction within a bigger uptrend, estimating the length and duration of a pullback is tricky. The stock could correct further with a move back to the resistance break or 200-day SMA. DIOD could also just retrace 50-61.8% of its prior move, which it did with the current pullback.
The zoom thumbnail focuses on the decline and a falling wedge formed. The stock bounced on Monday and then formed on Tuesday. A follow through breakout at 38.5 would reverse the falling wedge and provide the first sign that this pullback is ending.
Big Techs Lead as Banks Stall
- Key Levels to Watch for S&P 500
- QQQ Leads the Oversold Bounce
- Breaking Down XLK and XLC (MSFT, GOOGL, FB)
- Homebuilders Hold Up (ITB, LEN, DHI, PHM)
- Banks Extend Stall (GS, BAC, C, JPM)
- Click here to Watch
- Arthur Hill, CMT
Senior Technical Analyst, StockCharts.com
Book: Define the Trend and Trade the Trend
Twitter: Follow @ArthurHill


