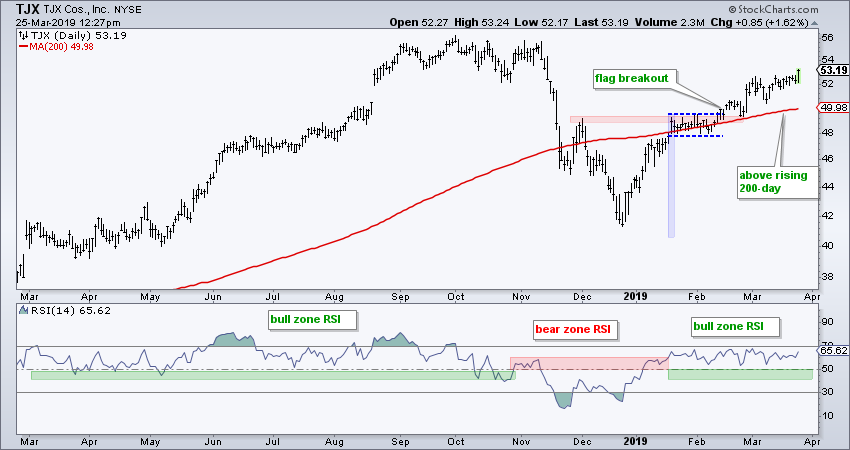
 TJX Companies (TJX) is part of the S&P 500 and the Consumer Discretionary SPDR (XLY). It is also part of two growth ETFs (PWB and PXLG). Even though TJX is part of an economically sensitive sector, I would put them in a different category because they are known as an "off price" retailer for apparel and home furnishings. The stock sports a strong chart and is trading at its high of the year (2019).
TJX held up better than the market in October, but succumbed to selling pressure in November and December. The stock rebounded with the rest of the market in January with a big surge back to the early December high (red zone). After consolidating for a few weeks with a flat flag, the stock broke out and continued higher. TJX is currently above its rising 200-day SMA and appears poised to challenge its October high.
The indicator window shows RSI shifting from a bull range to a bear range and back to a bull range. The bull range is from 40 to 80 and the bear range is from 20 to 60. RSI moved back into the bull range when it broke above 60 in mid January. I would consider momentum bullish as long as RSI holds above 40.
On Trend on YouTube - Thursday, March 21st
3 Big Sectors and Small-Caps Weaken
- Three Big Sectors Weaken in March
- Housing, Retail and Banks Turn Down
- A Bearish Setup for IWM (comparing RWM)
- Bond Market Leads the Fed
- Dynamic Yield Curve
- Click here to Watch
- Arthur Hill, CMT
Senior Technical Analyst, StockCharts.com
Book: Define the Trend and Trade the Trend
Twitter: Follow @ArthurHill


