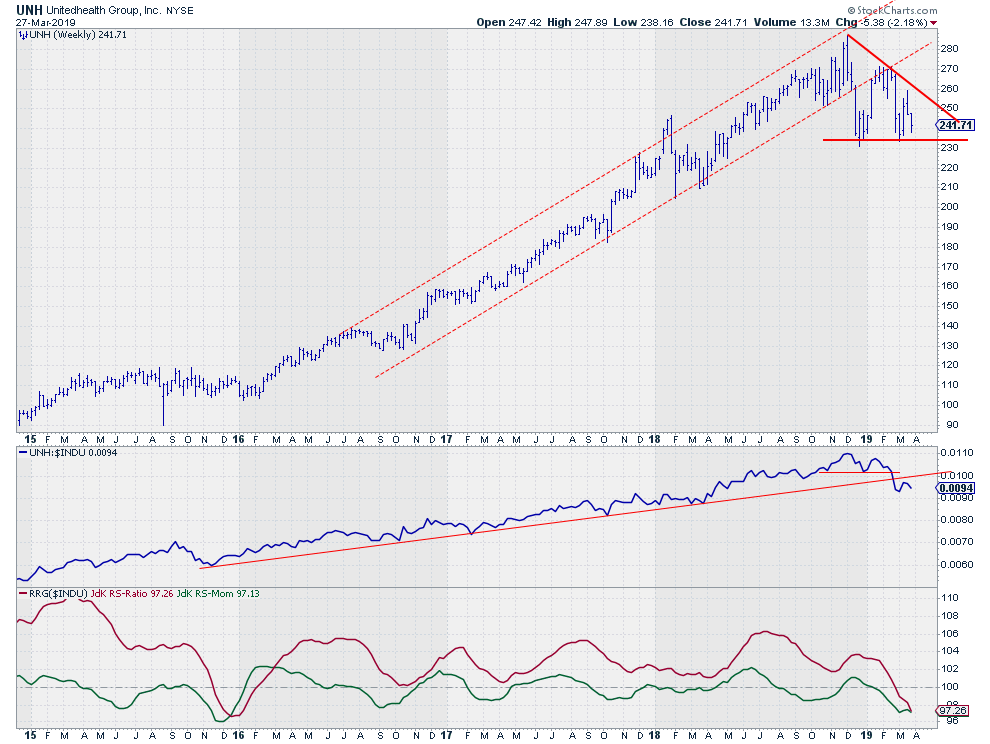
 The weekly chart for UnitedHealth (UNH) shows a steady uptrend in both price and relative (vs $INDU) since the start of 2016.
That three-year move just came to an end.
The uptrend in relative strength emerged out of the low that was set in late 2015. Since then, UNH is showing a steady series of higher highs and higher lows in relative strength against the DJ Industrials index. The red support line in the middle pane above marks that trend over a period of more than three years.
The RRG lines in the lower pane follow that relative uptrend higher. The JdK RS-Ratio crossed above 100, indicating a relative uptrend at the start of 2016 and remained above that level until a few weeks ago.
In relative terms, the first sign of weakness was the break below its previous low in the relative strength line, this was quickly followed by a break below the rising support line that had held all the way up.
Around the same time, the JdK RS-Ratio line dropped below 100, following RS-Momentum lower, which pushed UNH into the lagging quadrant on the weekly RRG.
On the price chart, the rising support line was broken in December after which a new support zone was established in the $230-$235 area. The rally out of that newly formed low did not manage to get back above former support and formed a new, lower, high against the former support line that started to act as resistance.
Very recently a new low was formed in the same area and another rally could not get past its previous high. This suggests selling power is coming in at subsequent lower levels while buyers are moderately available between $230-$235. The question is "for how long?"
Shifting to a daily Relative Rotation Graph shows a downward rotation for UNH inside the improving quadrant.
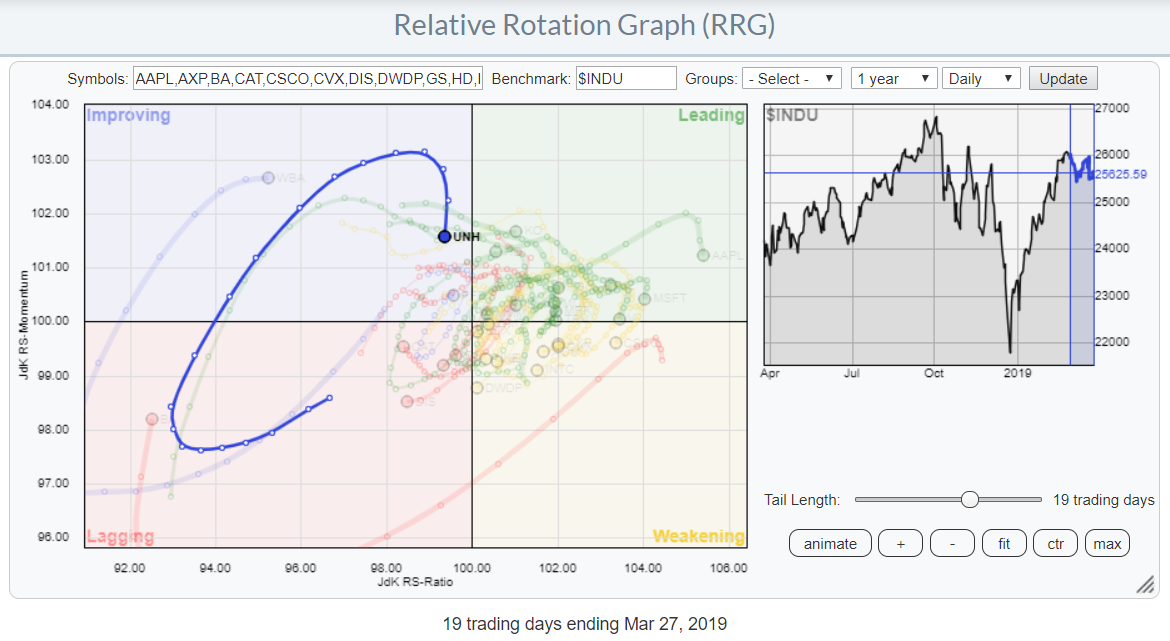 This rotation back towards the lagging quadrant will reinforce the weakness in relative strength on the weekly RRG where UNH is already moving further into the lagging quadrant.
A downward break out of the descending triangle that is building up after the break of support will only add more fuel to that downward move.
A break below $230-$235 with negative rotations underway on both the weekly and the daily Relative Rotation Graphs does not look good for UNH going forward.
My regular blog is the RRG blog If you would like to receive a notification when a new article is published there, simply "Subscribe" with your email address using the form below.
Julius de Kempenaer | RRG Research
RRG, Relative Rotation Graphs, JdK RS-Ratio, and JdK RS-Momentum are registered TradeMarks ®; of RRG Research
Follow RRG Research on social media:
Feedback, comments or questions are welcome at Juliusdk@stockcharts.com. I cannot promise to respond to each and every message but I will certainly read them and where reasonably possible use the feedback and comments or answer questions.
If you want to discuss RRG with me on SCAN, please use my handle Julius_RRG so that I will get a notification.


