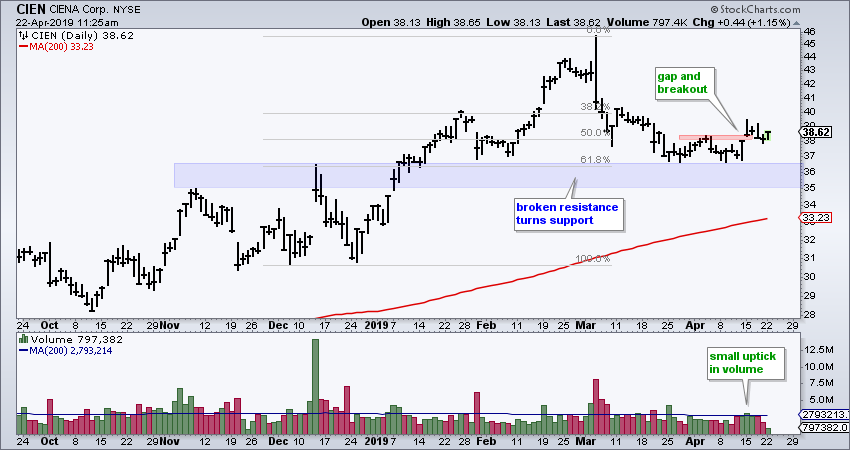
The ideal scenario for traders is to buy after a pullback for a good reward-to-risk ratio. When the long-term trend is up, I look for indications of support and signs that an upturn is in the making. The chart for Ciena sports a classic setup with a confluence of indicators pointing to support and signs of an upturn.
First and foremost, Ciena (CIEN) is in a long-term uptrend. The stock hit 52-week highs in February-March and remains well above the rising 200-day SMA.
CIEN fell back in March with a big one-day reversal on March 5th and decline to the 37 area. This zone marks the upper end of support (based on the broken resistance zone). In addition, this pullback retraced around 61.8% of the prior advance (December to March). It is common to retrace 38-62% of the prior move during a pullback.
There are signs that this pullback is ending as the stock gapped up and broke the early April high last week. Also notice that there was a small uptick in volume. It looks like Ciena is poised to end its corrective phase and resume its bigger uptrend. A close below 36 would warrant a re-evaluation.
Recent On Trend Videos
RSI for Trend-Momentum Strategies
Find, Track and Analyze Growth Stocks
Using Breadth Indicators to Weigh the Evidence
Arthur Hill, CMT
Senior Technical Analyst, StockCharts.com
Author, Define the Trend and Trade the Trend
Want to stay up to date with the latest market insights from Arthur?
– Follow @ArthurHill on Twitter
– Subscribe to Art's Charts
– Watch On Trend on StockCharts TV (Tuesdays / Thursdays at 10:30am ET)


