Intel (INTC) is one of the companies currently engaged in the 5G race. While all the attention was focused on the massive move in Qualcomm this week, Intel also quietly broke out to fresh new highs. This followed the company's announcement it would not be making smartphone 5G modems, but would focus on the network side of 5G. You can read more about that here. Intel has been quietly climbing and has also been outpacing the S&P 500, as shown in the purple area chart. When this INTC:$SPX ratio is sloped up, it means that Intel is outperforming the Index. With earnings on tap for April 25th, the news flow will probably accelerate this week.
The positive attributes on the chart continue to pile up. The SCTR ranking shows the stock price is moving faster than most stocks in the large cap space. The relative strength in purple is zooming higher, as mentioned above. The full stochastic indicator is staying above 80, which correlates nicely with rising prices on a weekly chart. The volume is slightly below average, but not bad for a short week. As the stock hitting fresh new 52-week highs, what we have is a bull market trait, not a bear market trait. The PPO shows momentum and is consistently moving higher. Last year, after a strong advance, the stock price wobbled a bit, but the momentum indicator stayed at a nice high level for months.
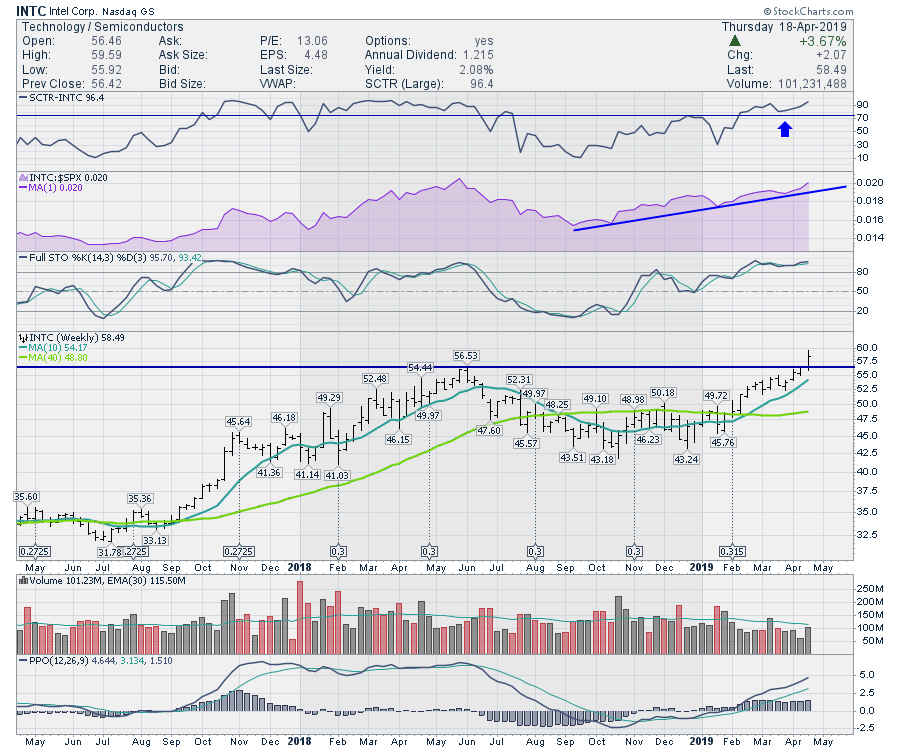 Across the board, the indicators are describing a strong stock. INTC is also due to make a dividend payment soon, as shown by the dropdown boxes on the price chart. There is lots of things to like about the INTC chart, and the renewed focus on what they are good at looks to have excited investors.
Be sure to check out my weekly roundup, which will be available on the StockCharts YouTube channel. If you haven't bookmarked the StockCharts YouTube page, that is a go-to place for lots of valuable technical analysis ideas.
Good trading,
Greg Schnell, CMT, MFTA
Senior Technical Analyst, StockCharts.com
Author, Stock Charts For Dummies
Want to stay on top of the market's latest intermarket signals?
– Follow @SchnellInvestor on Twitter
– Connect with Greg on LinkedIn
– Subscribe to The Canadian Technician


