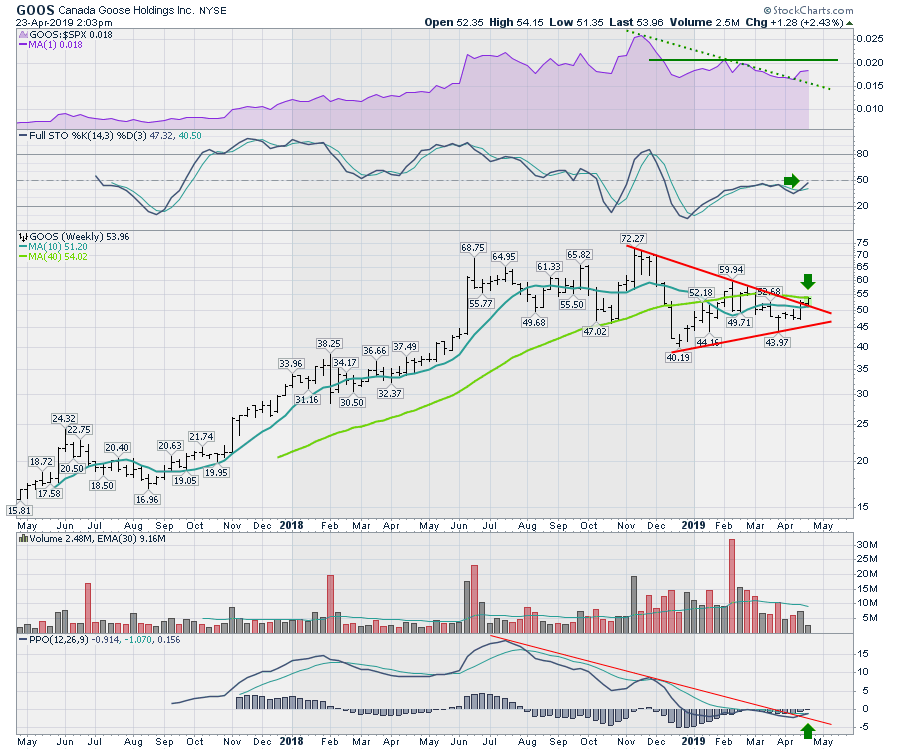
Buying retail at this time of year is tricky, but Canada Goose (GOOS) is sitting at an inflection point on the chart.
Over the last couple of weeks, the stock has moved through a downtrend in relative strength (shown on the purple area chart) and sits just below the three-month horizontal green line. The weekly full stochastic is trying to turn up above 50; after having been below for a while, it may now be pointing to a trend change for a swing trade. Price has broken the six-month downtrend following a move above the 10-week moving average. If it can move above $54.06, that would put it above the 40-week moving average. On this weekly chart, the price is making a series of higher highs and higher lows, which is a bullish trait. Additionally, the downtrend on the PPO is breaking this week right near the zero line. If this really is going to start moving higher, this would be an excellent clue from the PPO momentum indicator that the trend is changing.
 With the pullback in Canada Goose, this chart looks like a consolidation within the uptrend. While the swings were very wide, this is a nice place to consider the stock for a new trade. A stop below last week's low should give the price room to work.
Good trading,
Greg Schnell, CMT, MFTA
Senior Technical Analyst, StockCharts.com
Author, Stock Charts For Dummies
Want to stay on top of the market's latest intermarket signals?
– Follow @SchnellInvestor on Twitter
– Connect with Greg on LinkedIn
– Subscribe to The Canadian Technician


