Costco (COST) is one of the great retailers in the modern age. Recently, I went to Best Buy to buy some home electronics, but ultimately found out Costco had a better bundle at a better price. How a warehouse retailer offers better bundles than the specialists is a great question, but it's also the reason for Costco's success; they have a supplier design a bundled offering and it ends up being way better than the specialty retailer. That is true in everything from silverware to steaks, fruit to flowers or bread to butter. Somehow, it just works. Then you look at $25,000 diamond necklaces and $10,000 bottles of cognac. Who knew this would work?
So when I look at a Costco chart, I am always reminded that COST is one of the best out there. With that as the preamble, Costco's chart looks a little dangerous here. Let me work through the indicators.
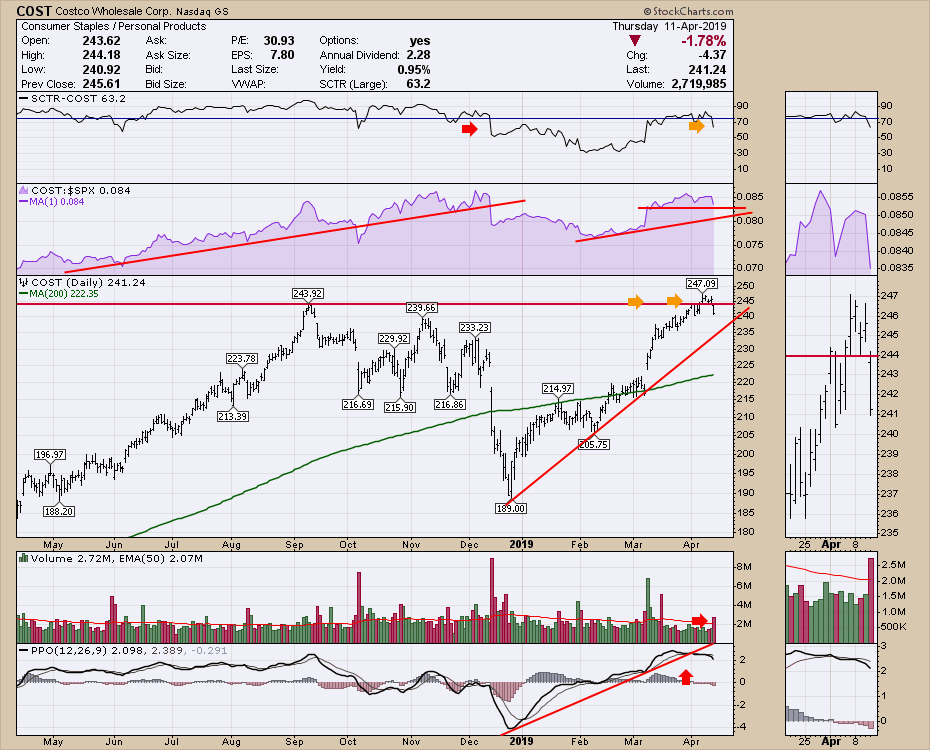
The SCTR ranking suggests Costco is having trouble behaving as one of the top stocks. The last time the stock fell out of the top 25%, it marked a significant pullback. As Costco is testing the prior highs, the SCTR is failing. This puts it on notice that the price action is not keeping pace with the rising market.
We might start seeing that become visible in the relative strength trend (in purple). It will be important for Costco that it remains in an uptrend relative to the $SPX, as investors like to buy outperforming stocks. This up-sloping indicator means that the stock is outperforming the $SPX. If that starts to fail, be wary once the price is unable to stay in the leading stocks on the SCTR.
The price action Thursday was dismal. Costco held above the prior high for 5 days, but Thursday saw the price snap below the support level. It is still above the trend line, but having the SCTR fail on one weak candle also suggests there could be more weakness. This drop occurred on high volume and on a PPO momentum indicator that has been drifting slightly lower from a high level.
 All of these together indicate that the daily chart is weakening. More importantly, though, what is the weekly chart doing?
This chart shows why a strong SCTR level is important and why a failure at 75 is a little concerning. One day doesn't mark the end, but having it occur on a test of the prior high suggests that investors are buying the breakout. Most of the other indicators are okay. The one exception is the PPO; as price is trying to break to new highs, this momentum indicator is at a much lower level. If price fails here, this will be another example of that typical divergence we see at market tops that fail to break out.
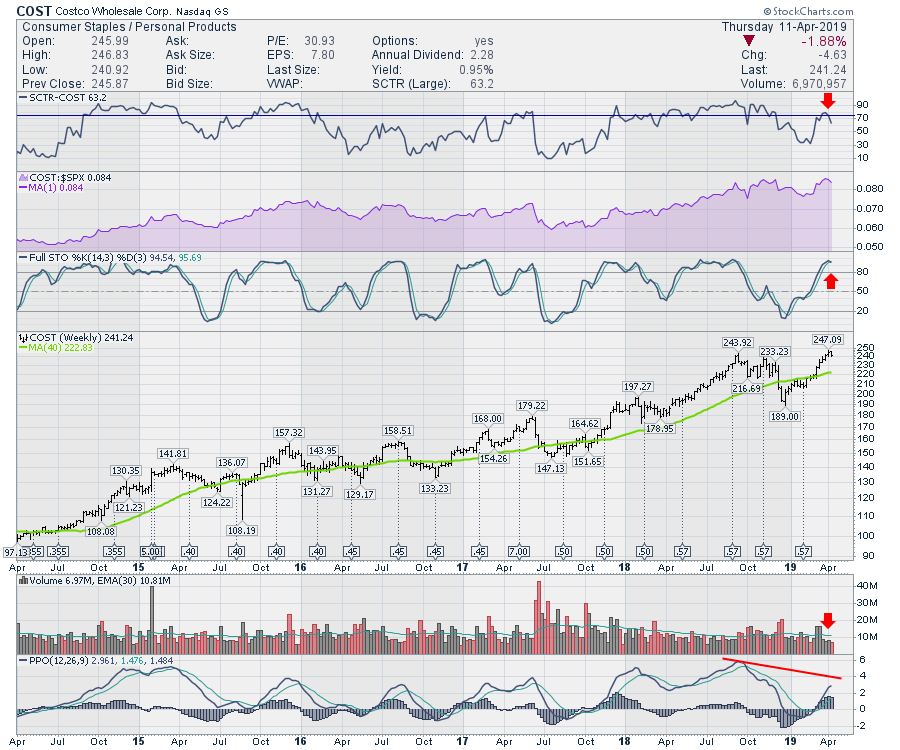
With that as a backdrop, it would be wise for investors to have a strategy to lock in their gains, in my opinion. This is a good place to play it safe in case the stock is going to fail at a prior high. Swing traders might want to take note of that weak momentum.
Good trading,
Greg Schnell, CMT, MFTA
Senior Technical Analyst, StockCharts.com
Author, Stock Charts For Dummies
Want to stay on top of the market's latest intermarket signals?
– Follow @SchnellInvestor on Twitter
– Connect with Greg on LinkedIn
– Subscribe to The Canadian Technician


