 Looking over some Relative Rotation Graphs this morning showed me that the Information Technology sector is currently the strongest sector in the S&P 500 universe.
XLK is positioned well inside the leading quadrant and is being powered further into that space by a long tail. It is difficult to conclude anything other than that this is a strong rotation.
Bringing up the weekly data, the RRG for technology stocks against XLK shows an image with a high concentration of stocks on the right-hand side of the graph (= positive territory) with tails pointing both up and down. Without zooming in, this area is hard to read.
Inside the improving quadrant, however, two tails are standing out for AAPL and NVDA. For this occasion, I want to focus on NVDA, but having AAPL inside the improving quadrant at a strong RRG-Heading is not a bad thing either.
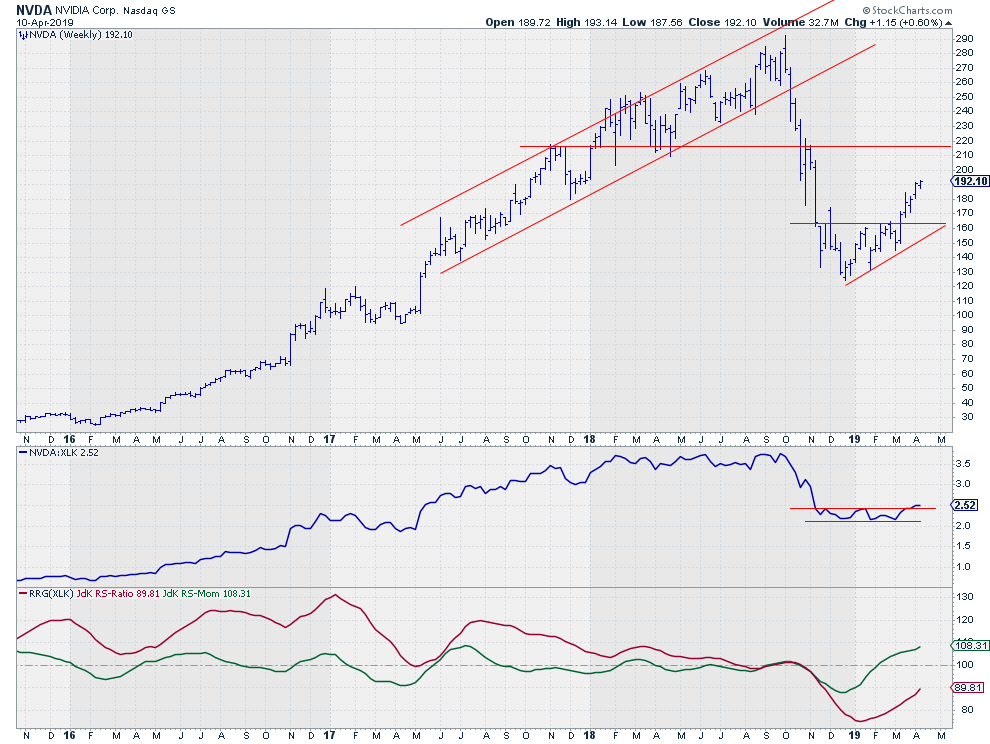
The NVDA chart shows a familiar pattern, going strong into 2018, experiencing a nose dive towards the end and recovering into 2019.
The relative strength for NVDA vs XLK flattened during the first half of 2018 and then dropped together with price, followed by sideways movement in the first three months of this year. During this flat period, the JdK RS-Momentum line started to recover, dragging RS-ratio from its lows. This combination is now picking up steam, causing the long tail and strong RRG-Heading inside the improving quadrant.
Outright calling one stock THE strongest in THE strongest sector would be very bold (and not my style either), but NVDA is certainly a name to keep an eye on as it is showing good potential.
My regular blog is the RRG Charts blog. If you would like to receive a notification when a new article is published there, simply "Subscribe" with your email address.
Julius de Kempenaer
Senior Technical Analyst, StockCharts.com
Creator, Relative Rotation Graphs
Founder, RRG Research
Want to stay up to date with the latest market insights from Julius?
– Follow @RRGResearch on Twitter
– Like RRG Research on Facebook
– Follow RRG Research on LinkedIn
– Subscribe to the RRG Charts blog on StockCharts
Feedback, comments or questions are welcome at Juliusdk@stockcharts.com. I cannot promise to respond to each and every message, but I will certainly read them and, where reasonably possible, use the feedback and comments or answer questions.
To discuss RRG with me on S.C.A.N., tag me using the handle Julius_RRG
RRG, Relative Rotation Graphs, JdK RS-Ratio, and JdK RS-Momentum are registered trademarks of RRG Research.


