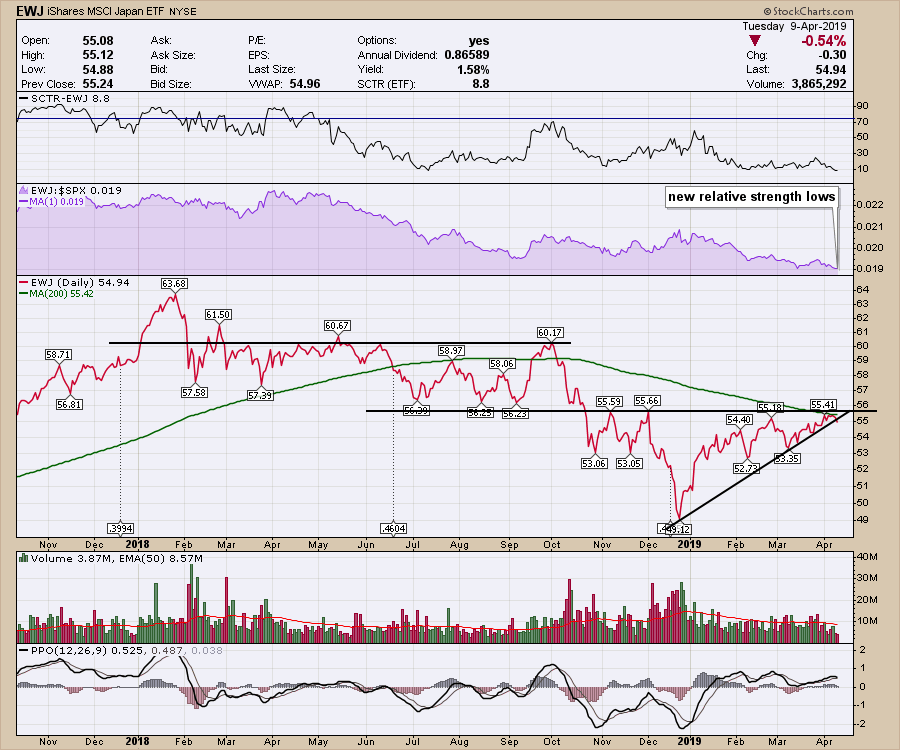
Japan is a market that I like to keep an eye on, as it's a big participant in the global economy. This week, the Japan ETF is in focus as it tries to get through the 200-day moving average, as well as make a topside breakout through a key resistance level. During major downturns like 2015, 2011, 2008 and 2000, the 200-DMA is a good moving average to keep tabs on after it goes below. With the bond market starting to fire off some significant clues, it also suggests a need for increased caution if these levels cannot be broken. Today, Japan started to break the 3-month uptrend off of the December lows. In overnight trading, the Nikkei is down a little more.
In analyzing the global market charts, I find Japan to be a key participant in macro uptrends.
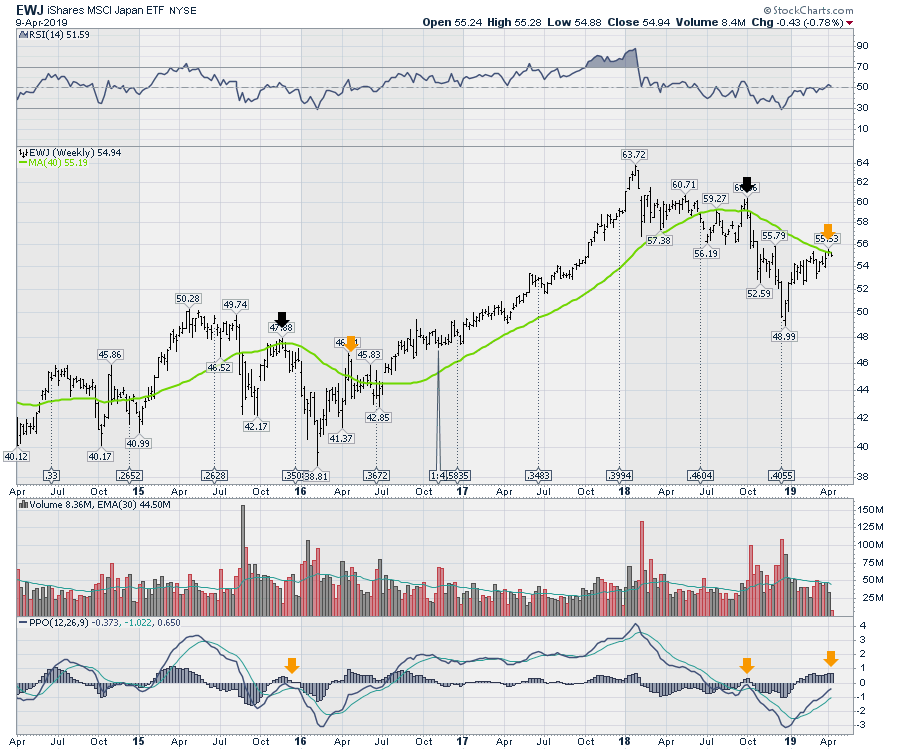
 Here is a 5-year view. (Watching the 40-week moving average is similar to a 200-day moving average.)
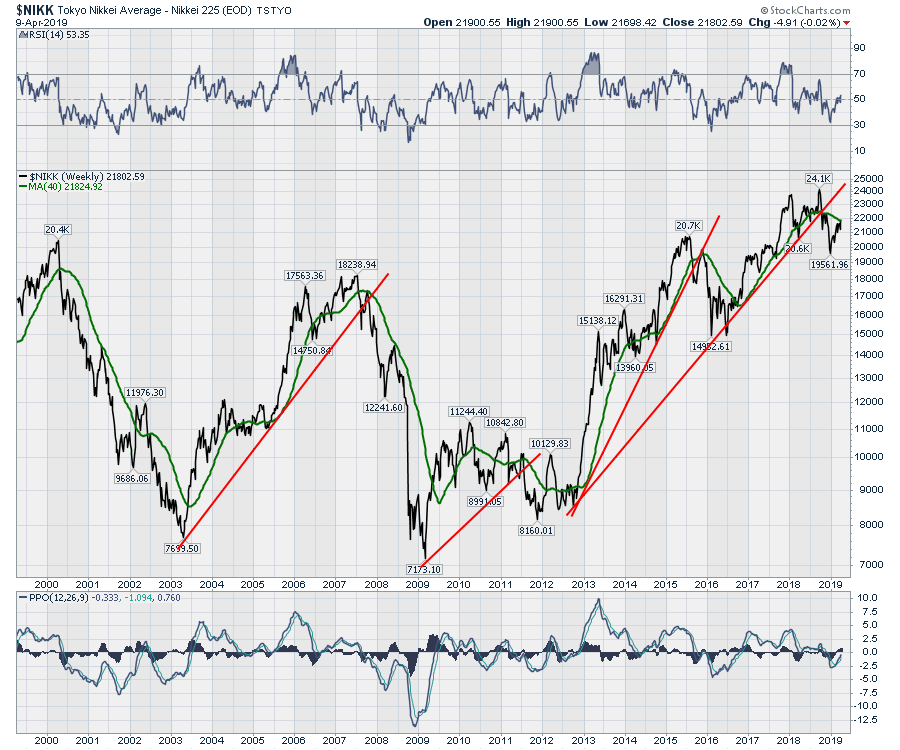
 To see the bigger picture going back to the late 1990s, I'll use the $NIKK, as we did not have ETFs with as much history back then. Notice how, in 2007, the $NIKK stalled under the 40-week moving average as the US markets hit their final high on October 9, 2007. The Nikkei can give us some noticeable signals, such as stalling at the 40-week moving average as the US market tops. So don't ignore the signals coming from the $NIKK or the EWJ. The foreign markets can offer helpful clues. Breakouts are helpful, stalling here is not!
 All that is to say: don't ignore this chart!
Good trading,
Greg Schnell, CMT, MFTA
Senior Technical Analyst, StockCharts.com
Author, Stock Charts For Dummies
Want to stay on top of the market's latest intermarket signals?
– Follow @SchnellInvestor on Twitter
– Connect with Greg on LinkedIn
– Subscribe to The Canadian Technician


