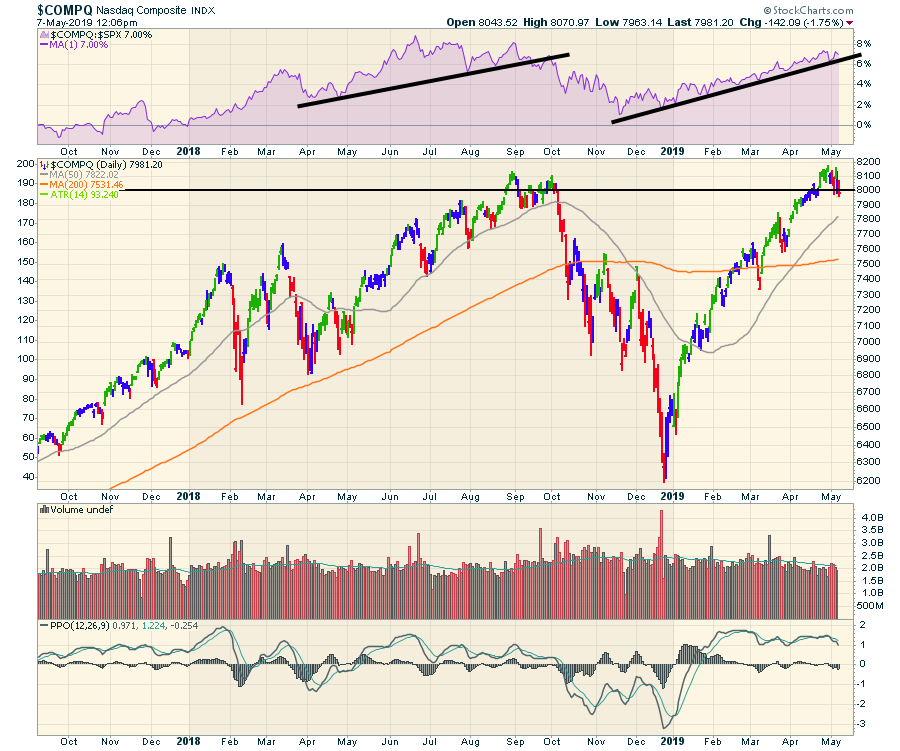
Looking at the broad composite charts below, we can see that both the Nasdaq and NYSE Composites are at important resistance points.
The Nasdaq Composite is hovering at important technical resistance; the black line could be at 8100, but, by putting it at 8000, we can give it some wiggle room. This is after a huge thrust of 32% off of the December lows.
 The other major index is the New York Composite. Notice how important 13000 is for the $NYA. The New York Composite is a better index for warnings and is usually the first to break. The broad markets continue to make lower highs while the $SPX makes higher highs, which is odd. While the $NYA usually underperforms the $SPX or $NDX, the momentum is accelerating lower on the PPO as the price tests this horizontal area.
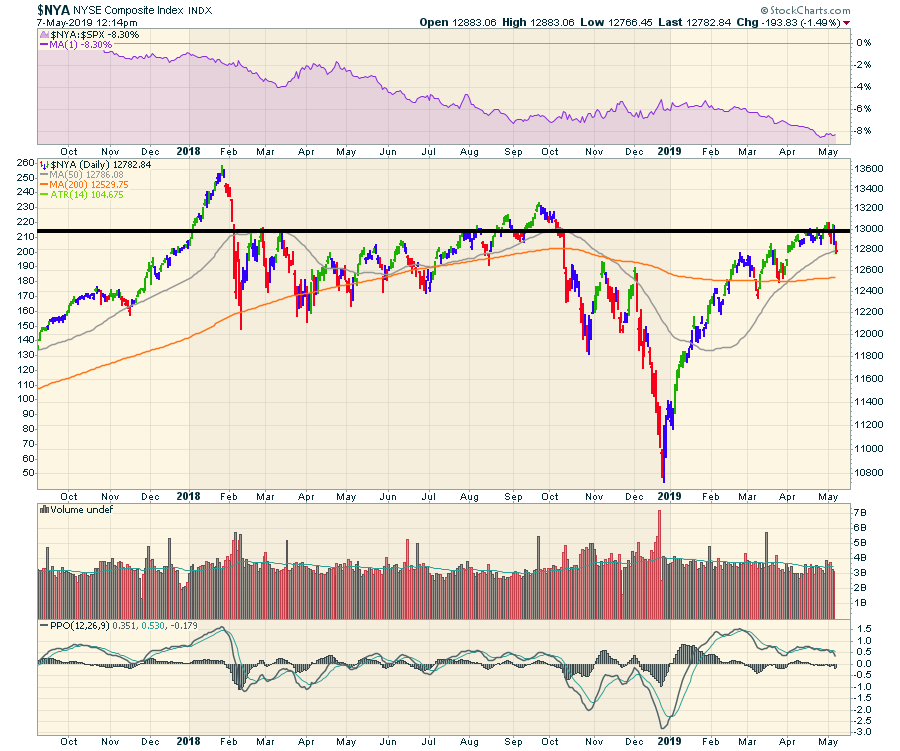 Obviously, the weakness is trade-related this week. The September 30th top was on completion of the USCAM agreement to replace the NAFTA agreement.
Looking at other indexes, we see similar issues.
The $RUT is also stuck at a major horizontal resistance level; it should be watched closely to see if it can hold up. Currently, the momentum shown by the PPO is a lot lower than on the February high; however, the momentum is still pointed up. I will point out a similar move on the January and September highs. The Russell topped early.
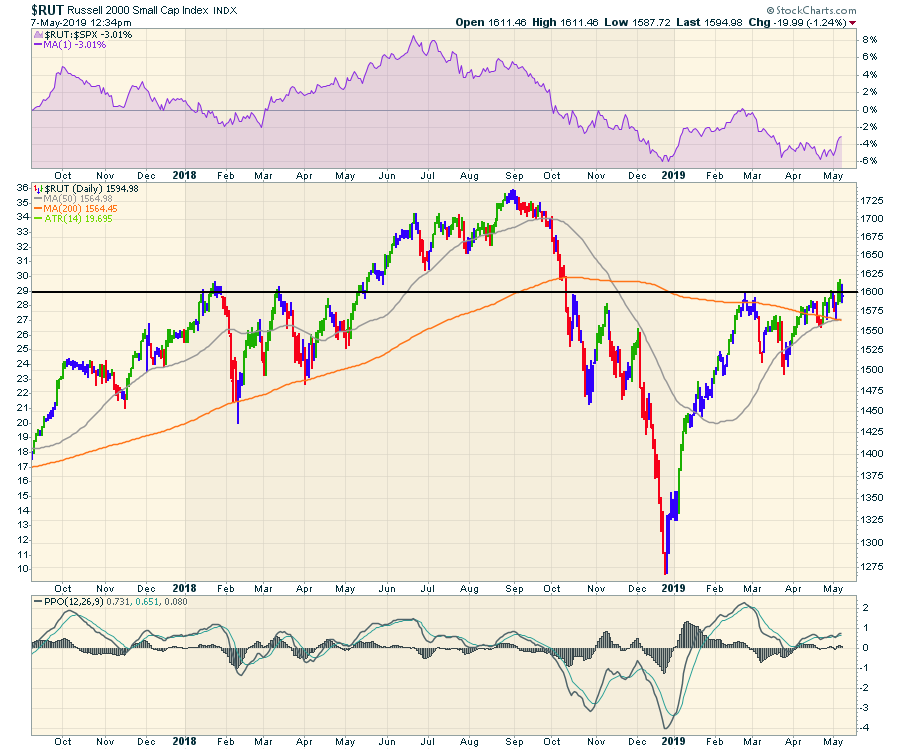 Most importantly, all of the momentum indicators are still in positive territory.
The bond market continues to signal issues and the commodity markets are dropping quickly, so there are flags on the field. The question is, can these markets hold up with PMIs declining worldwide?
Although everyone is very bullish, these indexes are stalling at prior highs. In the case of the New York Composite, we are on our second lower high. If the charts were to fail, this is typically where they would fail from.
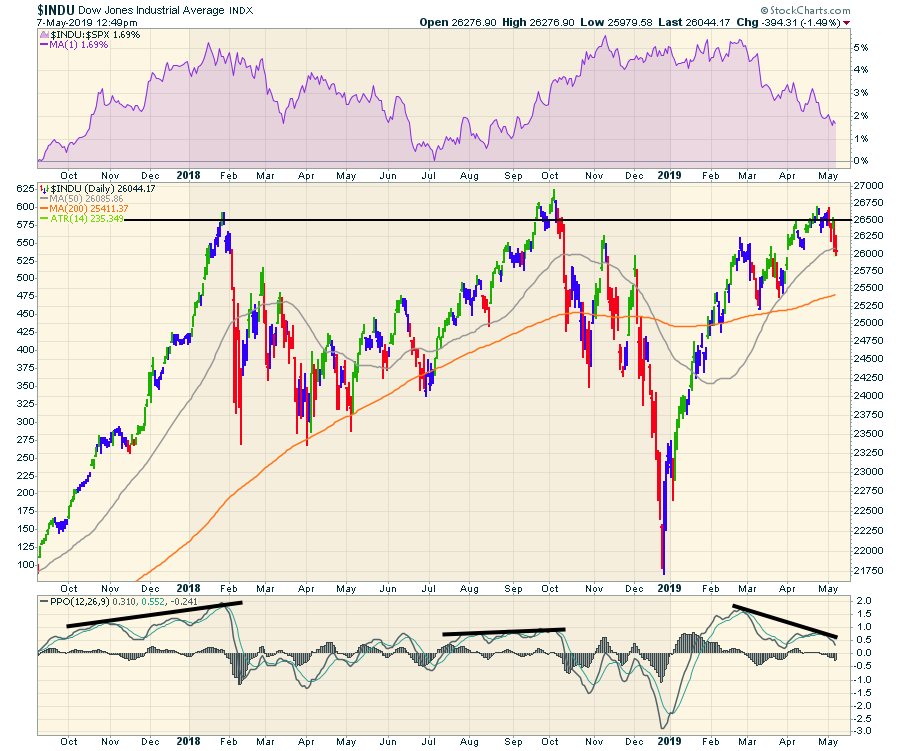
Lastly, the Dow has already wiped out all the gains in April within the first 5 days of May. Does this look like the potential for a head/shoulders top? Notice the momentum on the PPO heading into each high - first soaring higher, then a lot less strong, now very weak.
 It all boils down to watching the price action, not the rhetoric. While the bulls will trot out 2 indexes, the $SPX and $NDX, they were the last to follow, but still ended up busting lower. It may work out to the upside, but the current setup is not all sunshine and roses.
Good trading,
Greg Schnell, CMT, MFTA
Senior Technical Analyst, StockCharts.com
Author, Stock Charts For Dummies
Want to stay on top of the market's latest intermarket signals?
– Follow @SchnellInvestor on Twitter
– Connect with Greg on LinkedIn
– Subscribe to The Canadian Technician


