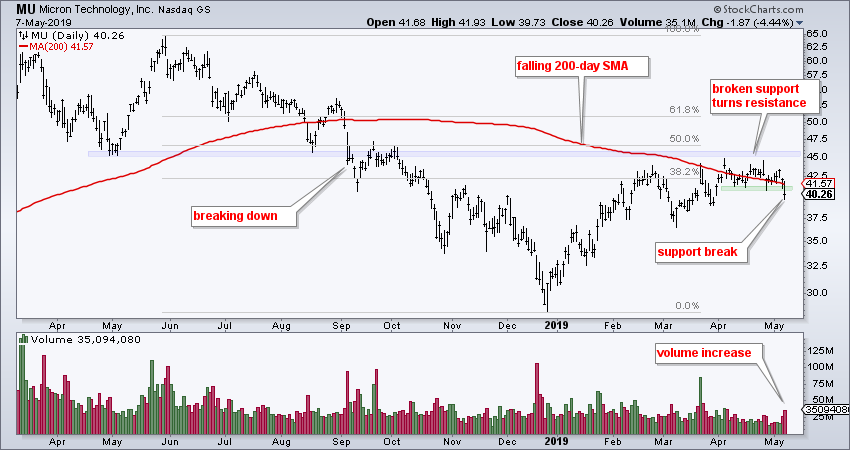
 A basic concept of technical analysis is that broken support turns into future resistance. This concept is proving true for Micron (MU) as it returned to broken support in April and backed off the last two weeks.
The chart shows MU breaking down with a support break in September and further weakness into late December. The stock recorded a 52-week low near 30 in late December and then rebounded to the 45 area by April. Even though a 50% advance off the lows is impressive, it retraced less than 50% of the prior decline and met resistance near broken support (blue zone). Also notice that the falling 200-day resides in the low 40s. The bigger picture is still bearish.
Micron stalled in the 43-45 area in April and then turned lower the last two weeks with a break below the April lows. This support break reverses the counter trend advance and signals a continuation of the prior decline. Also notice that the support break occurred with an increase in volume.
On Trend on Youtube (Tuesday, 7-May)
- Broadening Formation versus Uptrend
- S&P 500 is Ripe for Correction
- Russell 2000 ETF Breaks Out
- Healthcare and Biotech Buck the Selling
- Cyber Security ETF Works its Way Higher
- Stocks: PANW, PFPT, SCWX and ON
- Click here to Watch https://youtu.be/vxSlv4uvCEo
Arthur Hill, CMT
Senior Technical Analyst, StockCharts.com
Author, Define the Trend and Trade the Trend
Want to stay up to date with the latest market insights from Arthur?
– Follow @ArthurHill on Twitter
– Subscribe to Art's Charts
– Watch On Trend on StockCharts TV (Tuesdays / Thursdays at 10:30am ET)


