The four-year chart for Coty (COTY), a consumer staples fashion house, has not been one of beauty; rather, it looks like ten miles of bad road, as dad used to say. This month, though, something happened that changed the trend and put lipstick on my interest in the stock. Let's walk through the indicators together.
First of all, the SCTR surged early in the new year and pulled back. One-time surges can and do happen; it is the second trip to the top area that tweaks my interest. This is a bull trait. Some interest shows up, the stock relaxes, then interest shows up again.
The relative strength in the purple area chart is pushing to 10-month highs, which we don't see anywhere else on the chart. When a stock starts outperforming the $SPX, that attracts fund manager interest. As defensives have been leading the market lately, this stock looks to be one of them.
Last week, COTY's price tested a new 52-week high, but it was the strange sideways price action from February to May that suggested someone was building a position in the stock. The institutional investor tries to hold it in a narrow range while building their position size. Now, the stock has broken out. The volume profile also suggests a buyer bigger than my daughter's portfolio stepping in to buy into the makeup business. Those big up volume bars total around $8 billion, if I have done the math right. Looking left, we haven't seen that kind of attention in the stock for years! Lastly, the momentum has moved to the highest level in three years. This has all the traits of a trend change to me.
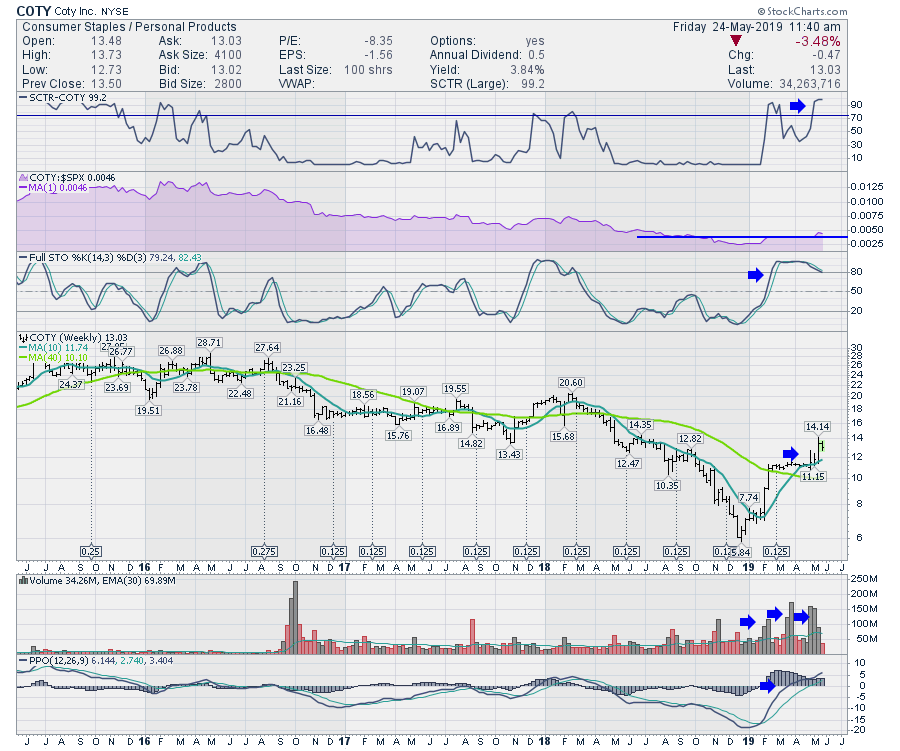 After the super surge last week, the stock is pulling back this week. It looks like a dividend is coming either today or early next week, going by the spacing. Getting a chance to buy it after a bit of a pullback makes for a better entry.
All this together suggests that this defensive name might have the strength to hold up against the winds of change that we are seeing on the trade front.
Good trading,
Greg Schnell, CMT, MFTA
Senior Technical Analyst, StockCharts.com
Author, Stock Charts For Dummies
Want to stay on top of the market's latest intermarket signals?
– Follow @SchnellInvestor on Twitter
– Connect with Greg on LinkedIn
– Subscribe to The Canadian Technician


