 Yesterday, I wrote about the relationship of US stocks against other international stock markets in my regular RRG Charts article.
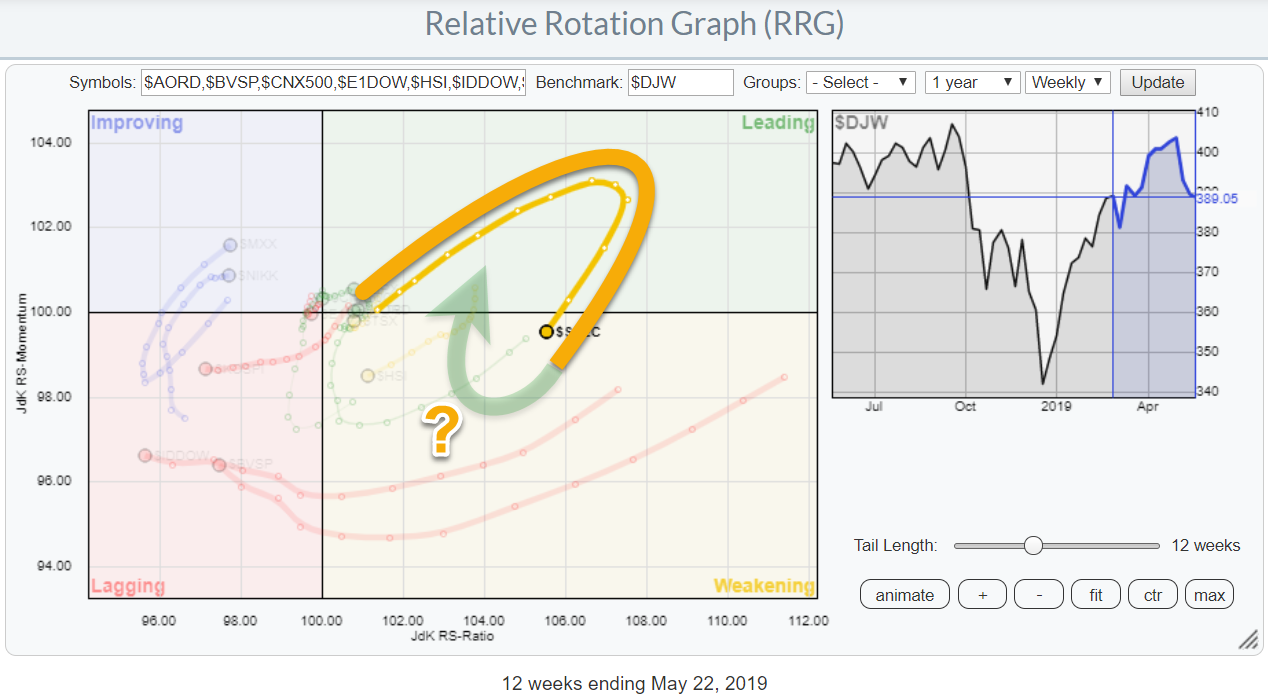
The Relative Rotation Graph that I use for these analyses is one of the pre-defined groups and is shown above.
While working on that article, I noted the long tail and the hook down on the Chinese market index $SSEC. Afterwards, I decided to make that chart today's chart to not be ignored.
Resting At Support Levels Near 50% Retracement
The Chinese market performed very well recently, starting at the end of last year, ultimately leading to a high near 3300. From that recent peak, the Chinese market is now down around 400 points, which equals around 50% of the previous rally.
As we all know, this 50% retracement level comes back in a lot of technical studies. On a stand-alone basis, I don't like to put too much emphasis on percentage retracement levels, but when they start to coincide with other "technical" levels, I do at least want to pay attention.
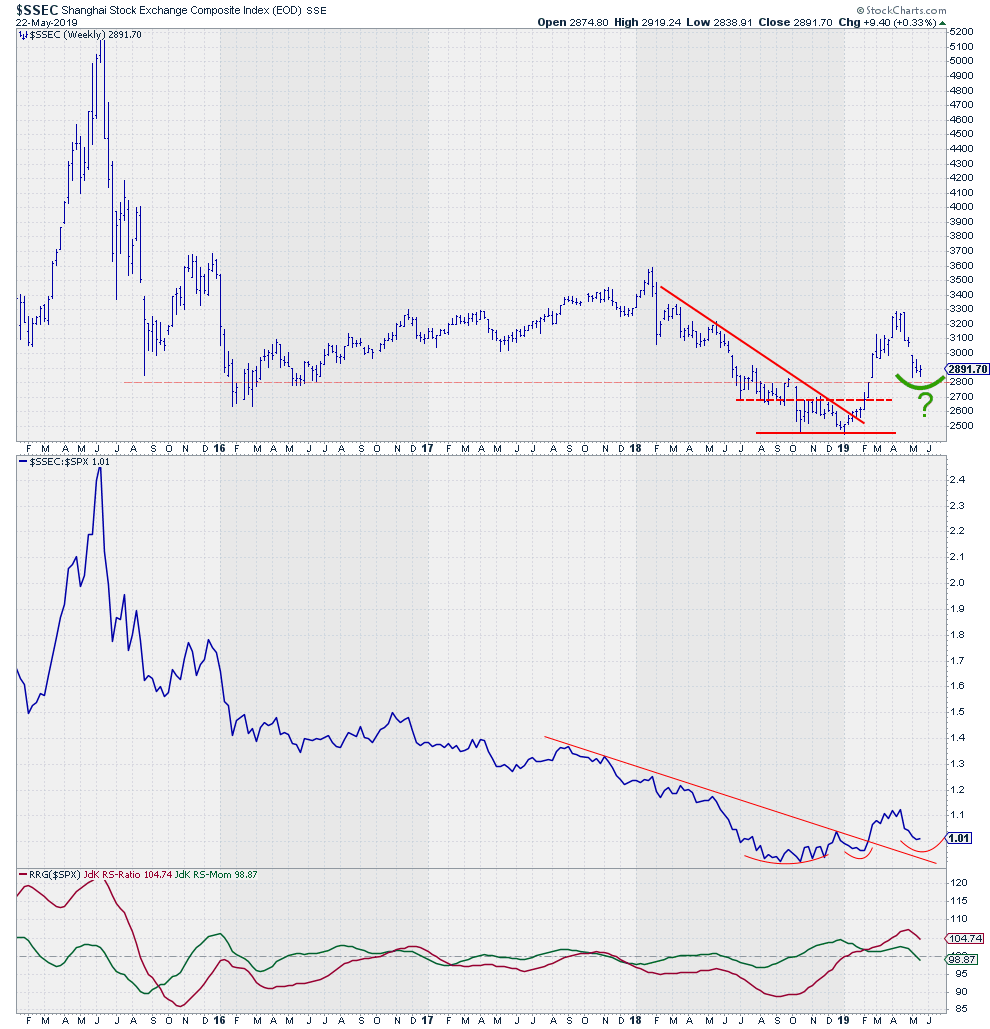 In this case, I am watching two support levels that are relatively close to this 50% retracement area. The first one is the area around 2800, which has served as support or resistance a few times in the past - not exactly to the dot, but enough to see some changes in supply and demand taking place around it.
The second one is the 2700 level, which is a bit more pronounced and served as the breakout level from the double bottom that got completed at the end of last year. The prior break above the falling resistance line, which marked the downtrend of 2018, only added to the credibility.
Relative Strength Turning Upward
From a relative point of view, the Chinese market has been characterized by underperformance since relative strength peaked in the summer of 2015. The RRG-Lines. especially the Jdk RS-Ratio, has been predominately below 100 since 2015 and only moved decisively above 100 at the start of 2019.
In the chart of the raw RS-Line, the falling trend line was recently broken to the upside. The first signs of higher, albeit still shallow, lows are now becoming visible. For this process to continue, $SSEC will need to start to form a new relative low fairly soon in order to keep up with the rhythm, keeping the RS-Ratio line above 100 and thus preserving the relative uptrend.
The good news is that the $SSEC is still the highest-ranked market on the JdK RS-Ratio scale, which means that there is plenty of room for it to curl back up while inside the weakening quadrant. I have cheekingly annotated the RRG at the top of the article accordingly. ;)
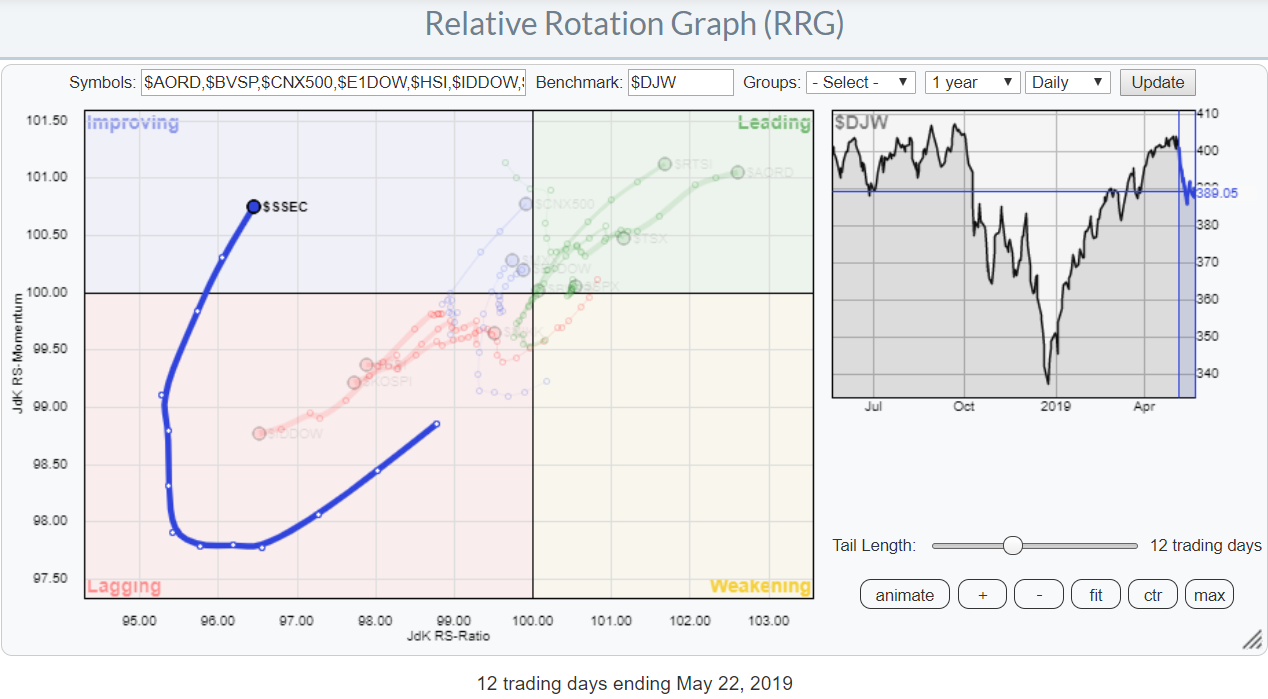
A final look at the rotation of $SSEC on the daily RRG shows that the tail here is well inside the improving quadrant and traveling at a strong RRG-Heading, indicating that short-term relative strength is improving.
The combination of a rotation through weakening on the weekly time-frame with a rapidly improving rotation on the daily RRG, as well as the price chart coming close to support levels that coincide with the 50% retracement level of the previous rally, make this a chart to watch more closely in coming weeks.
My regular blog is the RRG Charts blog. If you would like to receive a notification when a new article is published there, simply "Subscribe" with your email address.
Julius de Kempenaer
Senior Technical Analyst, StockCharts.com
Creator, Relative Rotation Graphs
Founder, RRG Research
Want to stay up to date with the latest market insights from Julius?
– Follow @RRGResearch on Twitter
– Like RRG Research on Facebook
– Follow RRG Research on LinkedIn
– Subscribe to the RRG Charts blog on StockCharts
Feedback, comments or questions are welcome at Juliusdk@stockcharts.com. I cannot promise to respond to each and every message, but I will certainly read them and, where reasonably possible, use the feedback and comments or answer questions.
To discuss RRG with me on S.C.A.N., tag me using the handle Julius_RRG.
RRG, Relative Rotation Graphs, JdK RS-Ratio, and JdK RS-Momentum are registered trademarks of RRG Research.


