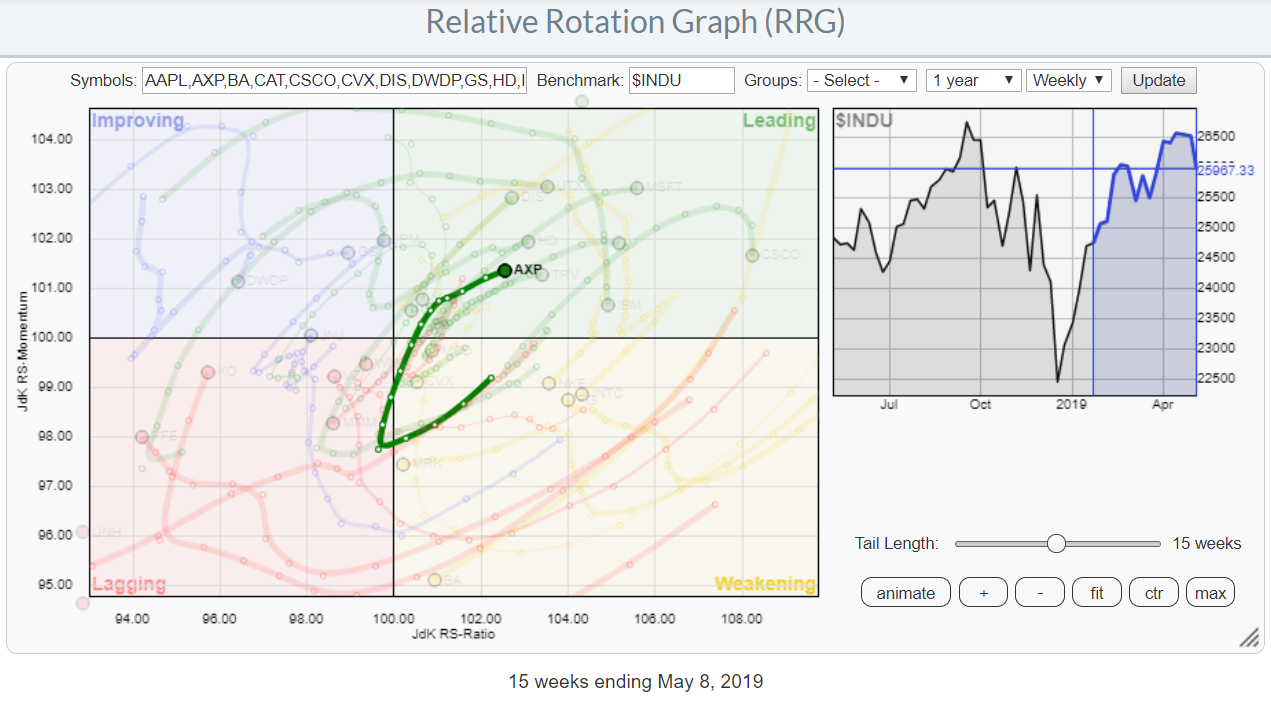
 Watching the Relative Rotation Graph for the DJ-Industrials universe, you can see a few stocks, like AAPL, BA and WBA, that stand out immediately. Despite the current setback in the market, there are still some stocks that are worth approaching from a buyer's perspective.
Inside The Leading Quadrant and At Strong Heading
One of these positive exceptions is AXP. You need to zoom in on the RRG to find it, as the area around the center of the chart is a bit crowded.
The best way to do that, IMHO, is to click "fit" to make the RRG use maximum screen real-estate, then select a line in the table below the chart that will highlight the tail of that stock. Then, browse through the various members of the universe by using the arrow keys; make sure to hold down "Ctrl" while doing this to prevent the chart from scrolling off the screen.
The Relative Rotation Graph at the top of this article shows what that looks like when AXP is selected.
As you may know from reading my previous articles, I always want to check my findings on an RRG against the price and relative action on a regular chart. Below is the weekly chart for AXP.
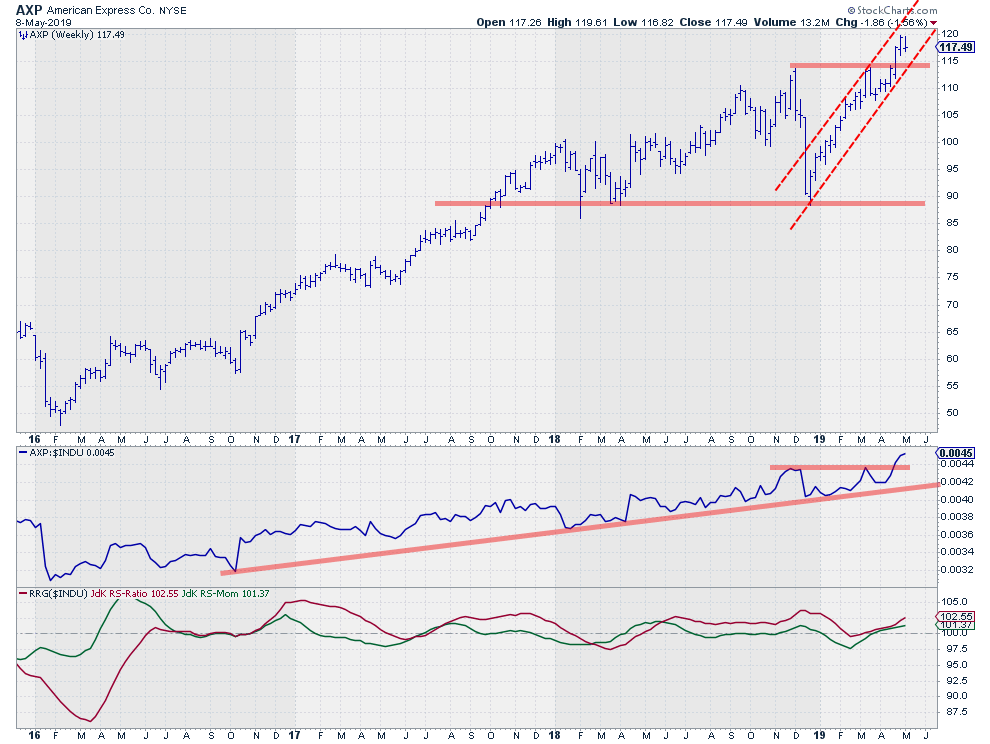
Breaking above the overhead resistance just below $115 three weeks ago was the most bullish thing AXP could have done. So far, it is holding up very well above that level; the rising channel that started at the beginning of this year is still fully intact.
Since Q1-2018, the relative trend against $INDU is predominantly up. The recent break above its previous highs is now confirming the strong position of AXP as compared to the other stocks in this universe.
All in all, this makes American Express a stock to keep an eye on.
My regular blog is the RRG Charts blog. If you would like to receive a notification when a new article is published there, simply "Subscribe" with your email address.
Julius de Kempenaer
Senior Technical Analyst, StockCharts.com
Creator, Relative Rotation Graphs
Founder, RRG Research
Want to stay up to date with the latest market insights from Julius?
– Follow @RRGResearch on Twitter
– Like RRG Research on Facebook
– Follow RRG Research on LinkedIn
– Subscribe to the RRG Charts blog on StockCharts
Feedback, comments or questions are welcome at Juliusdk@stockcharts.com. I cannot promise to respond to each and every message, but I will certainly read them and, where reasonably possible, use the feedback and comments or answer questions.
To discuss RRG with me on S.C.A.N., tag me using the handle Julius_RRG.
RRG, Relative Rotation Graphs, JdK RS-Ratio, and JdK RS-Momentum are registered trademarks of RRG Research.
