A few years ago, Walmart bought Jet.com, an online retailer. It was a big purchase of an unprofitable retailer, but the expertise of the online platform management was part of the action. On that note, Walmart reported strong earnings numbers yesterday above street expectations, crediting their online initiative for the growth. (The revenues were a touch light.) Walmart has allowed the online unit to really get rolling, which bodes well for management as acquisitions can die in large companies. I guess you could say they... fired up the jet! But can it lift the stock to new highs?
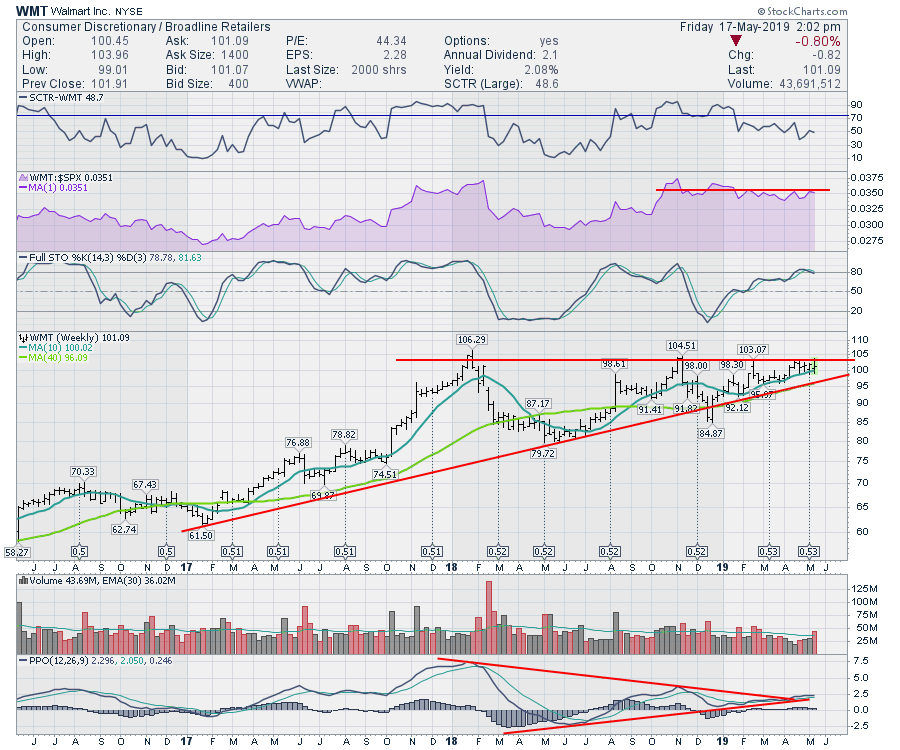
 Looking at the chart, Walmart is at a meaningful investment point. First of all, the two-year uptrend is continuing and the stock is just short of a new 52-week high. After surging on earnings yesterday, WMT a little soft today.
Looking through the indicators I use, WMT is hovering around 50 on the SCTR. That means that the price action is average when compared to other large-cap stocks. Relative strength (shown in purple), compared to the $SPX, has been flat over the last 4 months, which leads us to the same conclusion. The full stochastic indicator is at a cautionary point. We want it to surge into the top 20%, and I don't want to see the weekly full stochastic rollover at 80. Notice how the indicator merely wandered higher, rather than really shooting up.
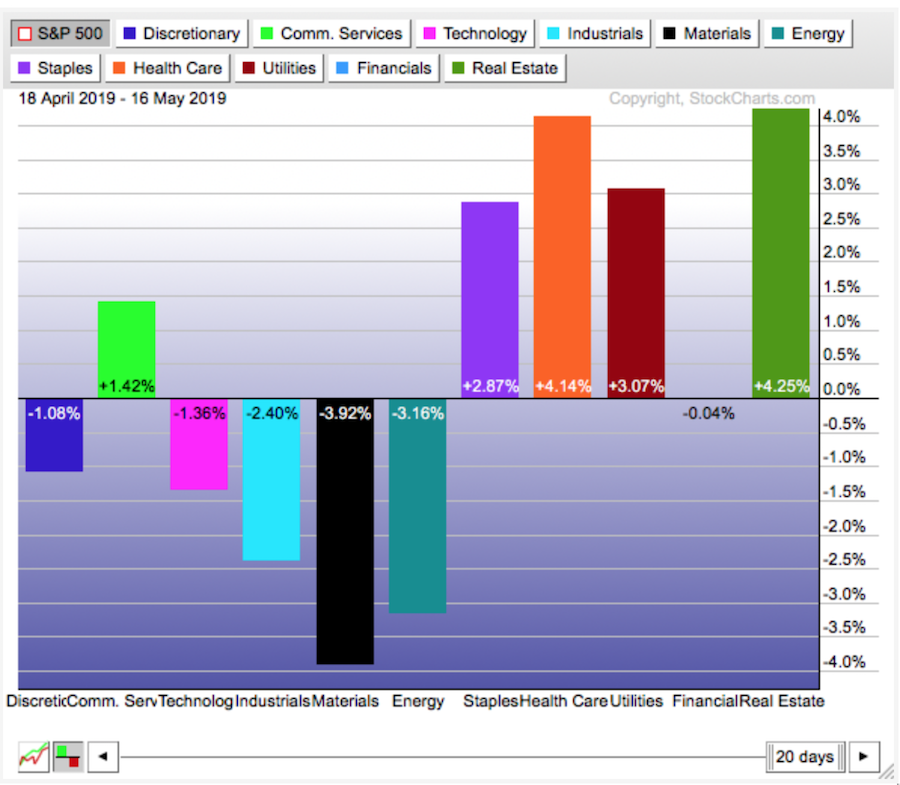
Walmart is a defensive stock with lots of cash flow, so it is always going to attract safety bids. If the market is rolling over here, I would expect a breakout to hold. If the market moves back to growth stocks, I would expect WMT to consolidate below the highs. As it tests this breakout, I would want to be long on a break to new 52-week highs, with a stop below the lows of the last four weeks at 98.85.
While the volume is always big, there is not a lot of information for me there.
I am particularly interested in the trend on momentum. After breaking above the downtrend line on the PPO, the indicator is gently riding the same trend as the rising lows. The fact that it is not surging higher is a little worrying. Slow momentum is ok, but it's not helpful for a breakout.
I like Walmart here partially because of the safety of the cash flow. Until it breaks out, I would remain cautious. As defensives continue to lead for the fourth week, you should be vigilant here.
Good trading,
Greg Schnell, CMT, MFTA
Senior Technical Analyst, StockCharts.com
Author, Stock Charts For Dummies
Want to stay on top of the market's latest intermarket signals?
– Follow @SchnellInvestor on Twitter
– Connect with Greg on LinkedIn
– Subscribe to The Canadian Technician


