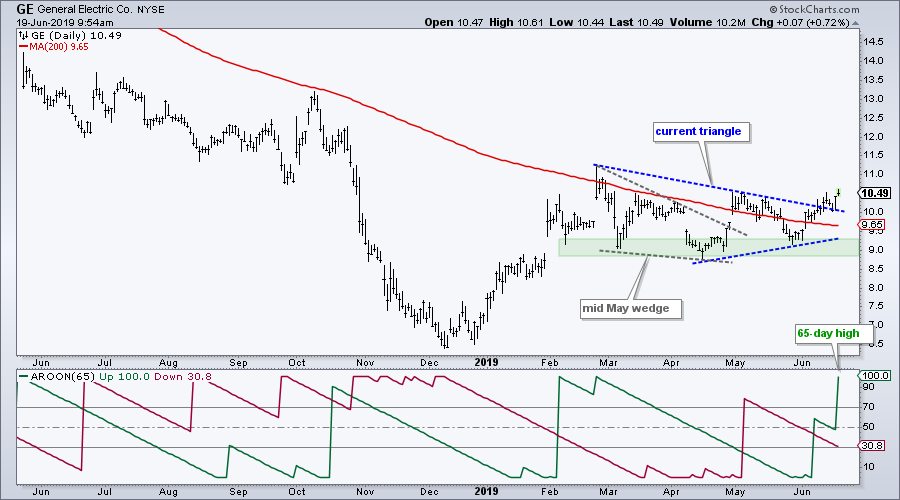
 I featured GE in mid-May as it attempted to break out of a falling wedge (DITC on May 15th). The breakout failed as the stock fell back in May, but a higher low formed and a triangle evolved. Overall, some sort of bullish consolidation formed from February to June and the stock is attempting another breakout.
The chart shows GE with the failed wedge marked in gray and the current triangle marked in blue. Notice that the stock held support in the 9 area with bounces in March, April and late May. This is positive because it reflects a basing process with a clear support zone to watch going forward. With the latest move above 10, the stock broke out of the triangle and this signals a continuation of the December-February advance.
The indicator window shows 65-day Aroon Up hitting 100 today. This means the stock recorded a 65 day high intraday. Thus, buying pressure is the strongest in months because the bulls pushed the stock above its March-April-May highs.
Despite a breakout in the making, GE is not totally out of the woods. It is barely above its falling 200-day SMA and below its March high. Thus, it is not one of the best performing stocks over the last four months. GE is also a low-priced stock and this usually means above average volatility (risk).
On Trend on YouTube (Tuesday, June 18th)
- Ranking Sector and Industry ETFs by RSI
- Biotechs Join Medical Devices with Breakout
- Healthcare and Biotech Stocks to Watch
- When Pullbacks Extend Further than Expected (TJX)
- Click here to Watch
Arthur Hill, CMT
Senior Technical Analyst, StockCharts.com
Author, Define the Trend and Trade the Trend
Want to stay up to date with the latest market insights from Arthur?
– Follow @ArthurHill on Twitter
– Subscribe to Art's Charts
– Watch On Trend on StockCharts TV (Tuesdays / Thursdays at 10:30am ET)


