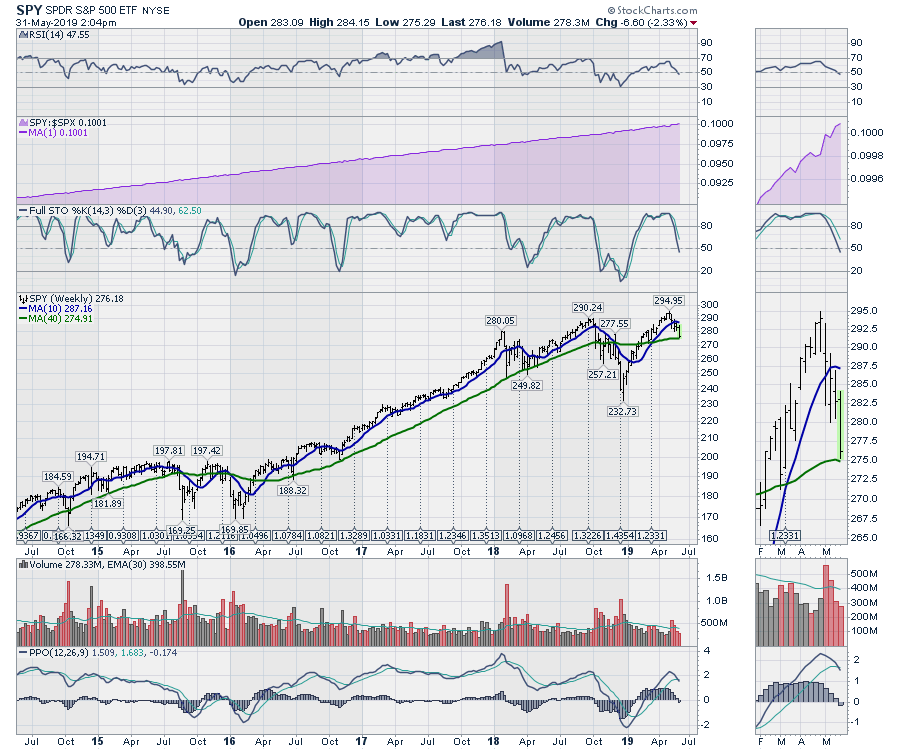
The SPY is a tracking ETF for the S&P 500. What that means is that SPY represents the price action of the $SPX; in fact, it actually outperforms the $SPX, as investors holding the SPY also get the dividends. The rising purple area chart below shows the SPY outperforming the $SPX, which is due to the dividend.
Looking at the weekly RSI, we have dipped below 50, which is bearish. In bull markets, we would expect this to bounce near the 40 level. The real problem is that the big push down in December to 30 suggests we have started a bear market. The recent rally almost got to 70, which would normally indicate a new bull market, but this is as stretched as a bear market should get if it was going to resume the bear market. The weekly full stochastic falling below 50 is associated with significant weakness. This is the first weekly close below the 50 level.
In the zoom panel, we can see the 40-week moving average turning down again. Should that continue, it will be important going forward as it would mark a long-term trend change. Lastly, the PPO has rolled over to a sell signal, coinciding with the Nasdaq 100 giving the same signal.
 Stay cautious, as this is not a bullish development.
This significant change in the market is also represented by the big breadth indicators I look at. I will have more information on Market Roundup this weekend. Since this also marks a month-end, this weekend's show will be a comprehensive look at the monthly charts worldwide. If you follow this link, it will take you to the page where you can select the Market Roundup playlist. The new video should be up late Saturday
Good trading,
Greg Schnell, CMT, MFTA
Senior Technical Analyst, StockCharts.com
Author, Stock Charts For Dummies
Want to stay on top of the market's latest intermarket signals?
– Follow @SchnellInvestor on Twitter
– Connect with Greg on LinkedIn
– Subscribe to The Canadian Technician


