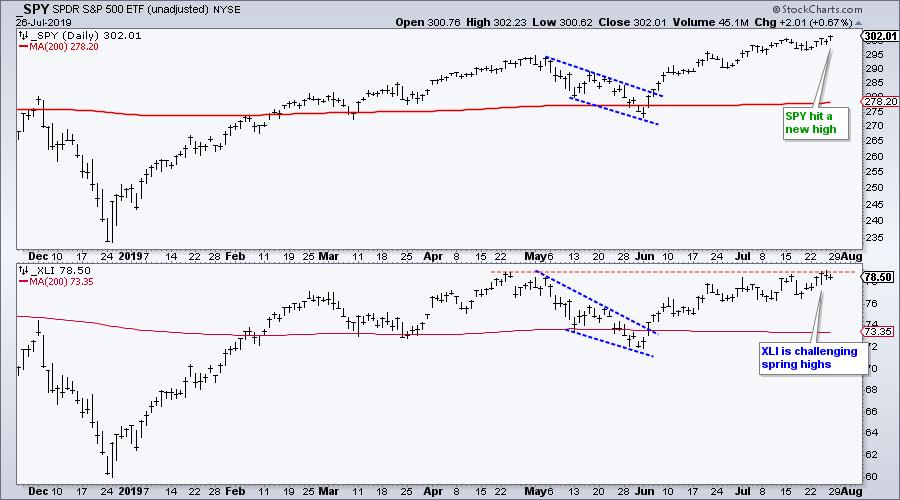
Fastenal, an industrial staples company, is reversing off a key level with an RSI failure swing working. Never heard of that sector? Let me explain. The company is a wholesale distributor for industrial and construction supplies, including nuts, bolts, screws, washers and fasteners. It does not get much more basic than that. Industrial manufacturers cannot do without these staples and Fastenal supplies them. The company has a market cap of around $18 billion and accounts for .78% of the Industrials SPDR (_XLI). XLI is challenging its spring highs after a 9% advance the last eight weeks.
Fastenal (FAST) is lagging SPY and XLI over the last eight weeks, but the stock is bouncing off a Reversal Alert Zone (RAZ) and poised for a breakout. First, FAST hit a new high in April and is in a long-term uptrend. The decline back to the 29-30 zone hit a RAZ marked by three items. First, the decline returned to broken resistance, which turns into support (blue zone). Second, the decline retraced 50-61.8% of the prior advance, which implies two steps forward and one step backward. Third, a falling wedge formed and this pattern is typically for corrections after an advance.
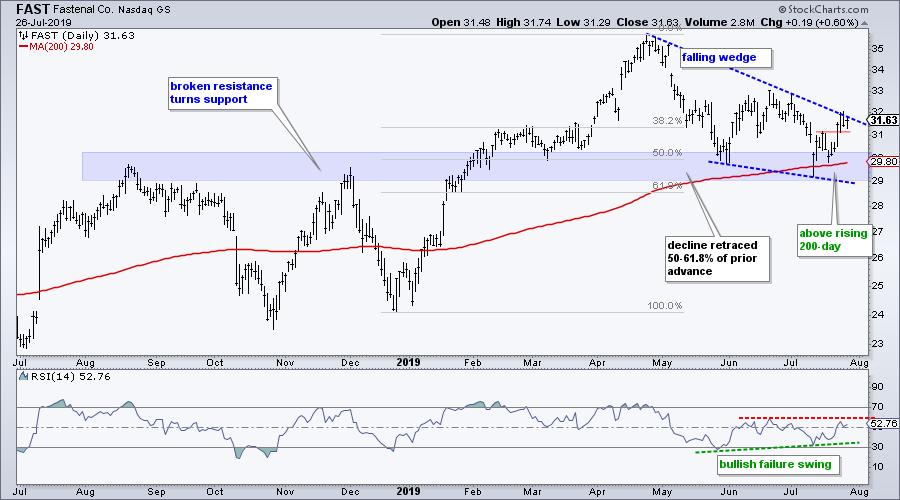
Short-term, note that FAST gapped down on July 11th and briefly dipped below the rising 200-day SMA. The stock recovered after this gap with a bounce to the wedge line and looks poised to break out from this pattern.
The indicator window shows RSI with a bullish failure swing. Keep in mind that a bullish failure swing is independent of price and includes four parts. First, RSI dips below 30. Second, RSI bounces. Third, RSI dips and holds above 30 (green line). Fourth, RSI break above its intermittent high (red line). A break above 60 is the last piece of the puzzle here.
Follow me on twitter: @arthurhill
Email comments: arthurh@stockcharts.com
State of Stock Market Video
- Index and Sector Breadth Tables Bullish
- New Signal from Mid-Cap %Above 200-day EMA
- Breadth and Price Charts for XLI, XLV and XLF
- Leading ETFs Making New Highs in July
- Reversal Alert Zones (RAZ's) in IBB and XBI
- Click here to Watch
-----------------------------------------------------------------------
Choose a Strategy, Develop a Plan and Follow a Process
Arthur Hill, CMT
Chief Technical Strategist, TrendInvestorPro.com
Author, Define the Trend and Trade the Trend
Want to stay up to date with Arthur's latest market insights?
– Follow @ArthurHill on Twitter
