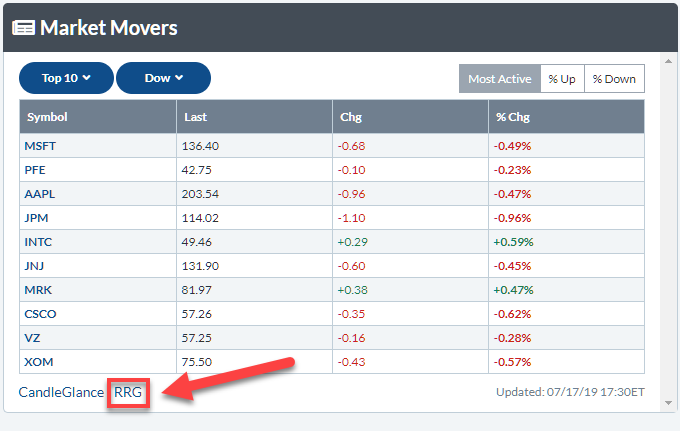
 When you open up StockCharts.com and go to Your Dashboard, one thing you'll find is a section called "Market Movers", located in the top-right corner of your screen.
I currently have this section of the page set up so that it shows the top 10 most active stocks inside the Dow Jones Industrials index. This way, it gives me a quick overview and general idea about the market behavior for the day. To expand that overview a bit further, I can then click on the RRG link below the table, which will run the Relative Rotation Graph for those ten stocks.
The default benchmark is $SPX, but that can easily be changed to any other benchmark if needed. In this particular case, I change the benchmark to $INDU, as I am looking at the most active stock inside that index.
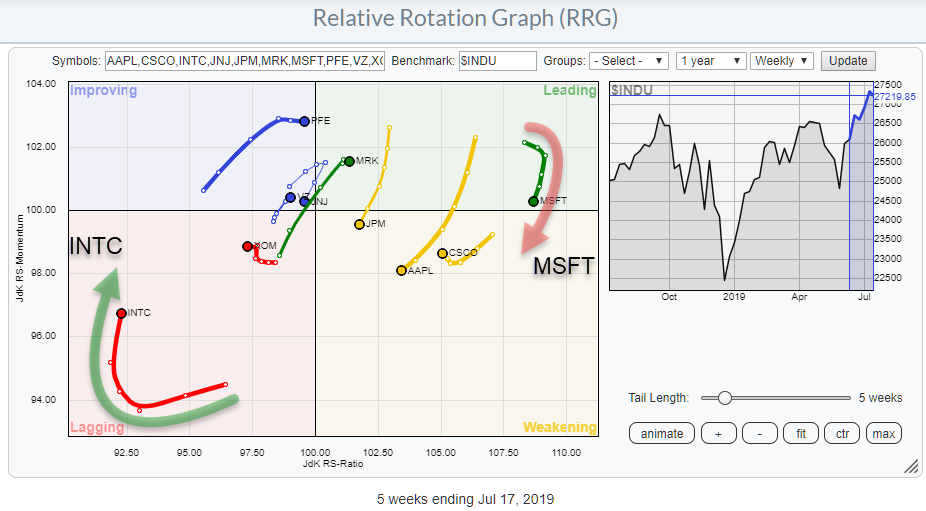
That gives me the RRG below.
Now, the table from my dashboard has been translated into a visual overview. Two interesting rotations stand out. Inside the leading quadrant, MSFT has rolled over and is now heading down towards the weakening quadrant. Simultaneously, inside the lagging quadrant, INTC has made an opposite move and is now rotating upward towards the improving quadrant.
Although MSFT is still at the far right-hand side of the RRG, which means a strong relative trend, while INTC is at the far left-hand side of the RRG (weak relative trend) on the weekly time-frame, they may offer a nice (pair-trading) opportunity.
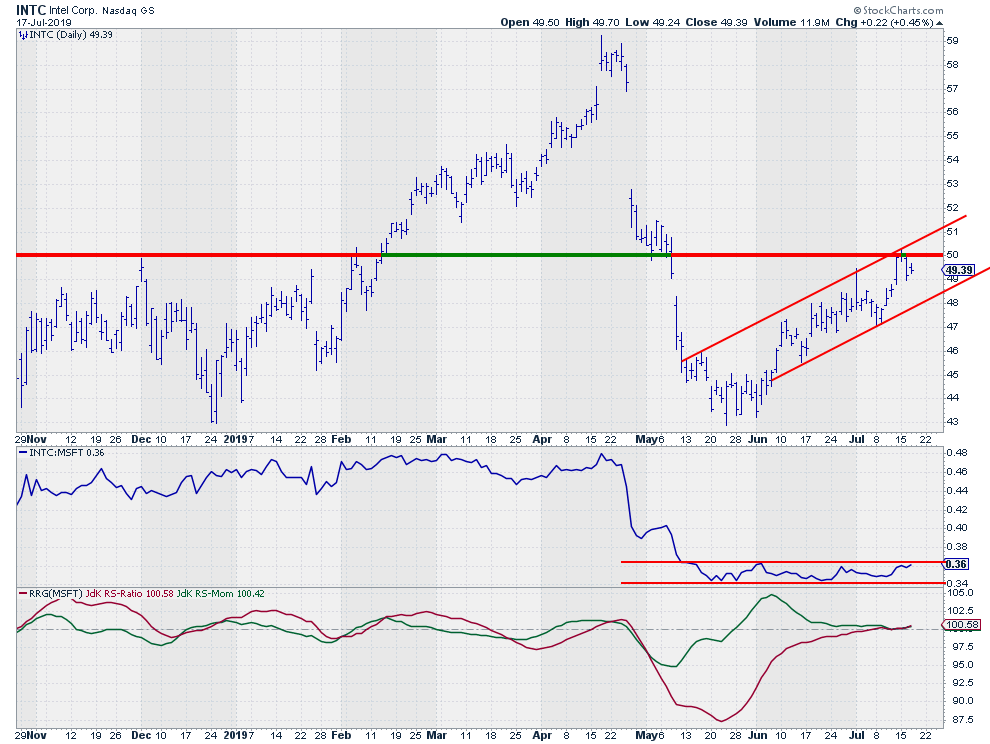
As a final investigation, we need to look at the actual chart(s) for those stocks. For this article, I have created a chart of INTC with relative strength and RRG-Lines against MSFT.
 Starting with the relative analysis, we can see the sharp drop in relative strength from April into May and the stabilization in June. That stabilization has caused the RRG-Lines to converge and work their way up to the 100-level.
Be careful as these RRG-Lines are INTC vs. MSFT and on a daily time frame, so they are a different, more granular comparison than that on the weekly RRG above.
The RS-line is now pushing against the upper boundary of the range it has been moving in recently. A breakout from that range will be the trigger for a move higher in RS and a further improvement of INTC over MSFT.
On the price chart, a new channel is starting to develop. A break above the overhead resistance near $50 will certainly help the improvement of relative strength for this pair.
My regular blog is the RRG Charts blog. If you would like to receive a notification when a new article is published there, simply "Subscribe" with your email address.
Julius de Kempenaer
Senior Technical Analyst, StockCharts.com
Creator, Relative Rotation Graphs
Founder, RRG Research
Want to stay up to date with the latest market insights from Julius?
– Follow @RRGResearch on Twitter
– Like RRG Research on Facebook
– Follow RRG Research on LinkedIn
– Subscribe to the RRG Charts blog on StockCharts
Feedback, comments or questions are welcome at Juliusdk@stockcharts.com. I cannot promise to respond to each and every message, but I will certainly read them and, where reasonably possible, use the feedback and comments or answer questions.
To discuss RRG with me on S.C.A.N., tag me using the handle Julius_RRG.
RRG, Relative Rotation Graphs, JdK RS-Ratio, and JdK RS-Momentum are registered trademarks of RRG Research.


