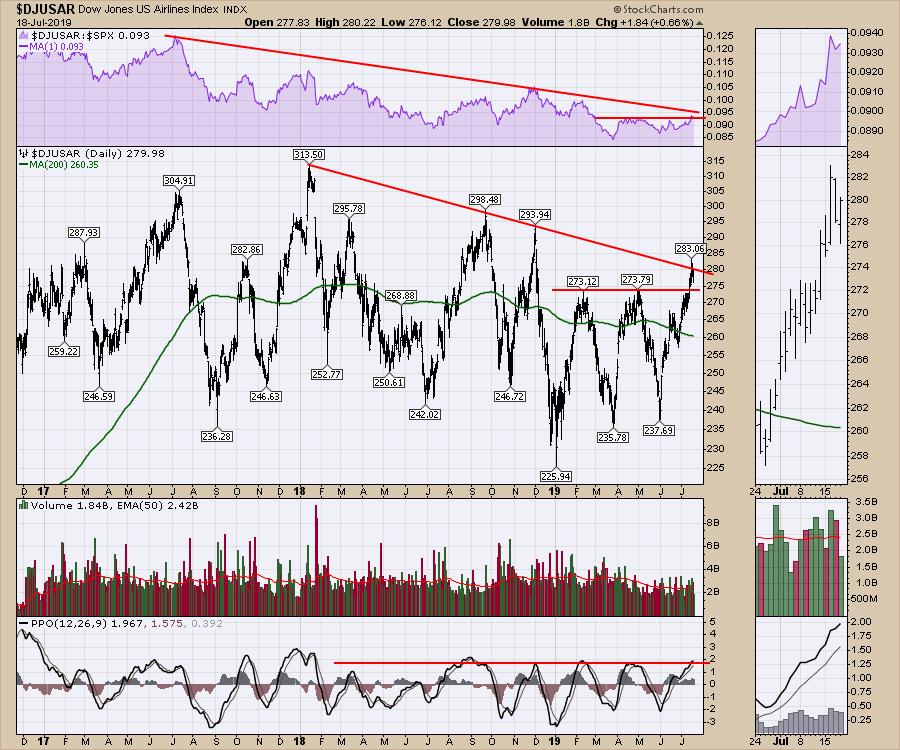
Airline price charts are starting to improve. The big question is - why? After years of going sideways for the industry group, is it possible that now is the moment to be optimistic that something is changing? Well, the industry daily chart does not look all that optimistic.
The weekly chart has one particular indicator that is getting interesting. The momentum indicator I am using is the Price Percentage Oscillator (PPO), which has just moved above zero and has also moved above its signal line (it's hard to tell just from the chart, but I have put the zoom panel on the end so you can see it). Notice that the airline PPO rolled over, with each top on the $SPX in the bottom panel. As the chart finally tries to make a break, it is also pushing the PPO indicator up against the down-sloping trend line. A break in this long-term downtrend might mark the change in trend from sideways to up for the airlines.
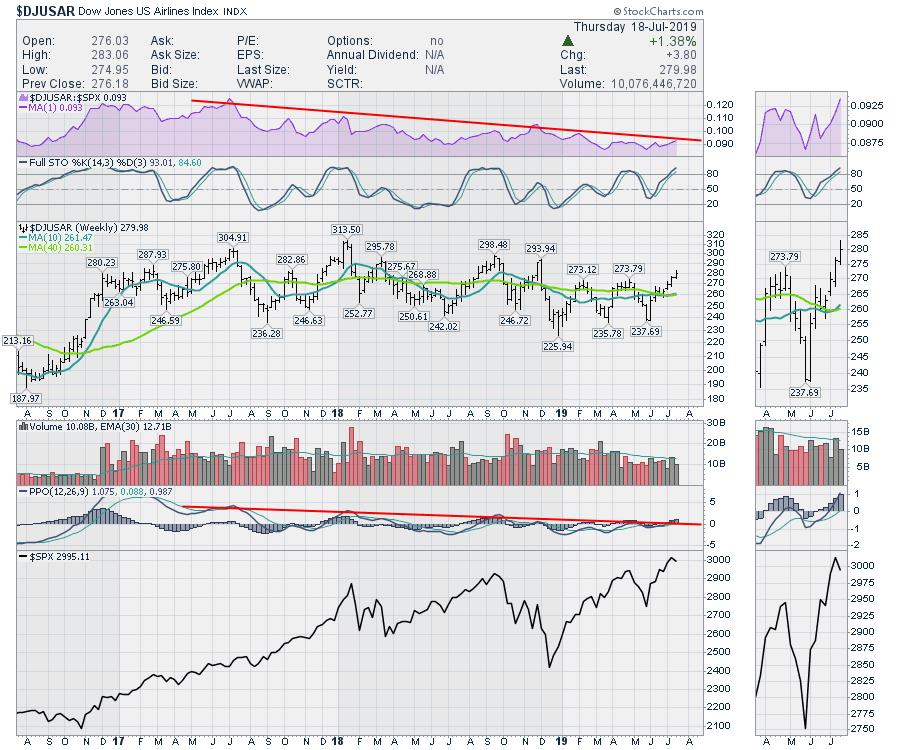
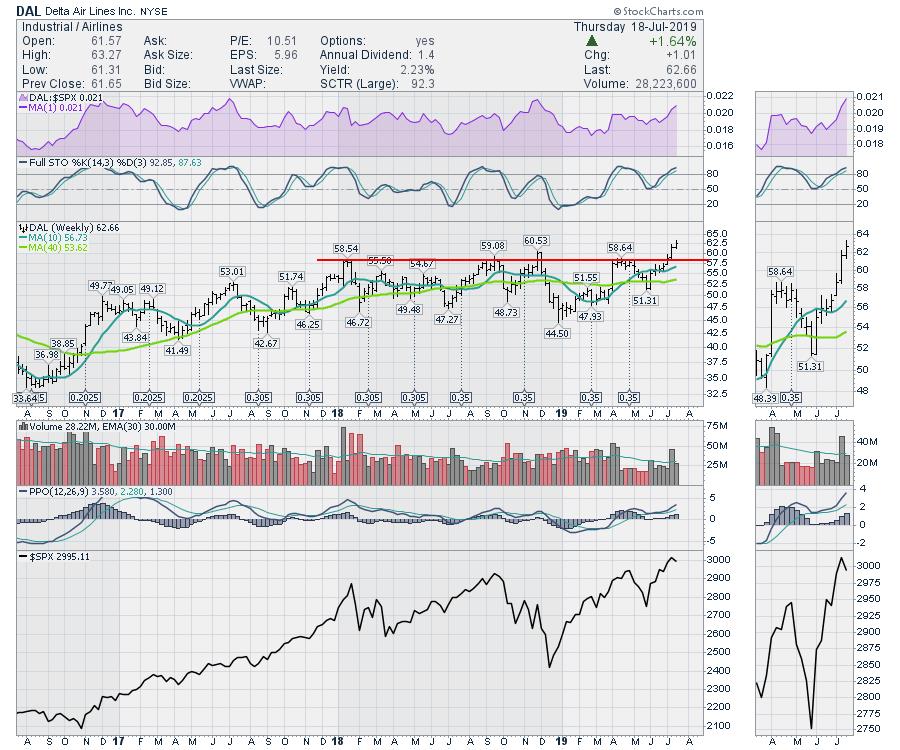
One of the reasons this may be happening is that the reduction of available planes may be tightening up the number of available seats, pushing revenues higher for the airlines. While the airlines are not off the ground yet, some of the individual charts look better than the industry average.
It is the breakout from this big sideways area that suggests a change is in the air. It might be time to change the air in your portfolio and look for higher highs. I worked through all the transportation stocks on Wednesday's Market Buzz, so check that out for more information.
Good trading,
Greg Schnell, CMT, MFTA
Senior Technical Analyst, StockCharts.com
Author, Stock Charts For Dummies
Want to stay on top of the market's latest intermarket signals?
– Follow @SchnellInvestor on Twitter
– Connect with Greg on LinkedIn
– Subscribe to The Canadian Technician
– Email at info@gregschnell.com
