The tale of Ali Baba has him opening a door into a treasure trove using the words "open sesame."
After wandering in a trading range for the last two years, Alibaba (BABA) is setting up in one of my technical favorites - not just for the upside, but also for the ability to control risk in entering the trade.
Looking at the SCTR, which is like a sports ranking for stocks, we can see BABA making higher highs and higher lows. I want to see the stock move the SCTR above 75, which would suggest the price action is better than 75% of the large cap stocks.
The comparison of the stock price performance to the S&P 500 is shown in the shaded purple area. When this trends higher, the stock is outperforming the index. Currently, the stock is just short of hitting new 3-month highs in relative strength.
The full stochastic is right at 50. One of the things we notice on strong stocks in a bull trend is that they usually make it all the way above the 80% level. When they fail to do so around the 50-60 level on the full stochastic, that is usually associated with the continuation of a downtrend following a rally. A good example of that would be in December 2018, shown on the chart below.
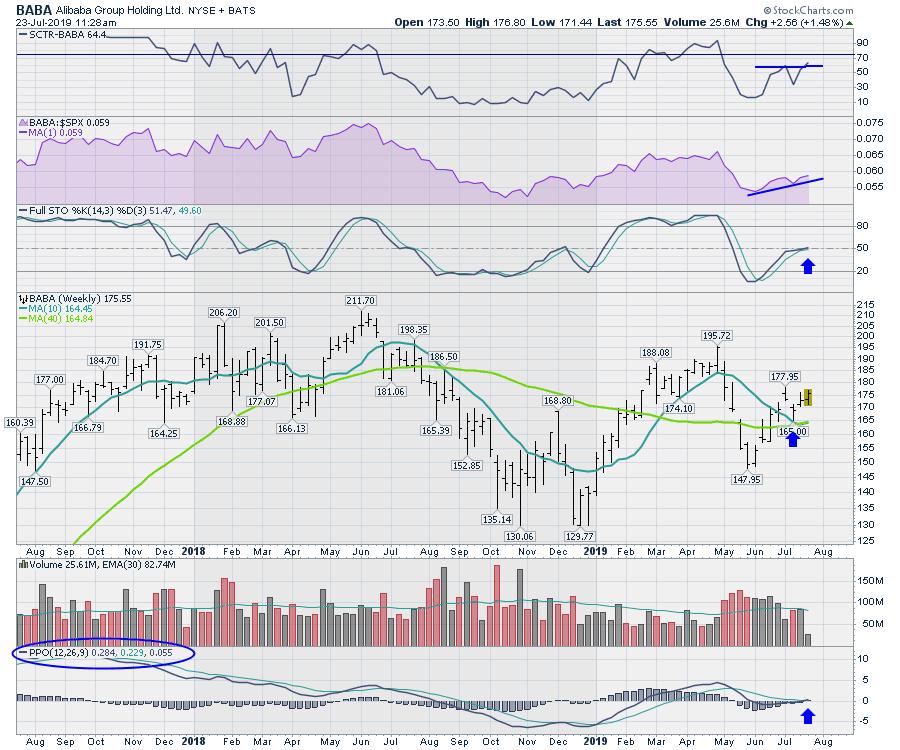
As we can see, the PPO has just turned positive and the momentum waves have made a higher low. The PPO helps us visually observe momentum. Over the course of 2019, BABA rallied and momentum moved above zero. After the recent pullback, the stock looks to be bottoming out near zero and has just crossed its signal line. We can see that all three numbers on the legend are positive, indicating that the PPO line has crossed above the signal line. It is very bullish when this happens around zero.
If the full stochastic fails here and turns down, the PPO would also return to negative. That's just not a good place to own a stock; a tight stop would kick you out and let someone else own it. The opportunity for entering gets pushed down the road while you don't continue to own a weak stock. A stop below the moving averages is probably wide enough to let the stock wiggle if it doesn't run right away.
In summary, the setup is nice, but two indicators can help us make sure we stay on the right side of the big picture trade. Let's continue to watch and see if BABA can become the next behemoth to add some riches to your portfolio. "Open Sesame!"
Good trading,
Greg Schnell, CMT, MFTA
Senior Technical Analyst, StockCharts.com
Author, Stock Charts For Dummies
Want to stay on top of the market's latest intermarket signals?
– Follow @SchnellInvestor on Twitter
– Connect with Greg on LinkedIn
– Subscribe to The Canadian Technician
– Email at info@gregschnell.com


